3D Poincaré Plot of the Logistic Map


Requires a Wolfram Notebook System
Interact on desktop, mobile and cloud with the free Wolfram Player or other Wolfram Language products.
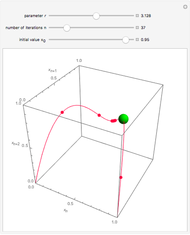
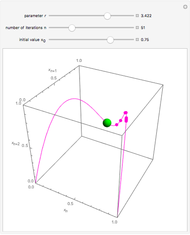
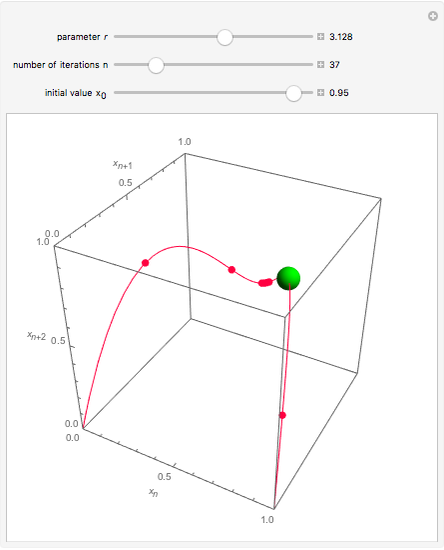
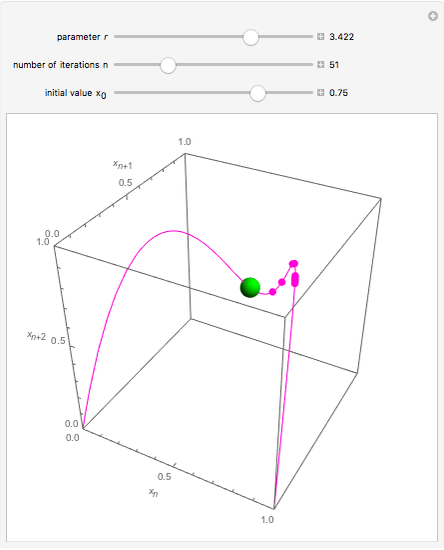
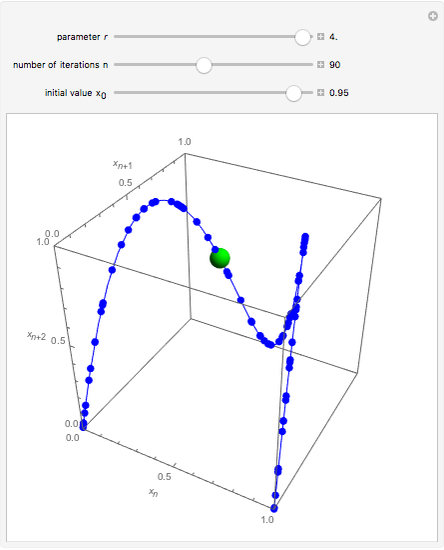
The logistic map is given by  , where
  is a parameter. The 3D Poincaré plot of this map is the set of points
  in 3D, which lie on the curve
  , where
  . The plot shows the curve and the points (
 ,
,  ,
,  ). The green ball shows the current iterate; past iterates are marked on the curve by smaller points. Observe that as
  approaches 4, the plot points fill nearly the entire curve, and the behavior becomes chaotic. For smaller values of
  , the iterates can either converge to a single point or oscillate between several limit points.
Contributed by: Narken Aimambet (August 2015)
(Illinois Mathematics Summer REU Program 2015)
Open content licensed under CC BY-NC-SA
Snapshots

Details
detailSectionParagraphPermanent Citation
"3D Poincaré Plot of the Logistic Map"
http://demonstrations.wolfram.com/3DPoincarePlotOfTheLogisticMap/
Wolfram Demonstrations Project
Published: August 4 2015
 Time-Series Analysis for Generalized Logistic Maps with z-Unimodality
Ki-Jung Moon Finite Lyapunov Exponent for Generalized Logistic Maps with z-Unimodality
Ki-Jung Moon Iterates of Generalized Logistic Maps for Superstable Parameter Values
Ki-Jung Moon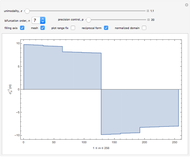 Trajectory-Scaling Functions for Generalized Logistic Maps with z-Unimodality
Ki-Jung Moon Bifurcation Diagram for a Generalized Logistic Map
Ki-Jung Moon Feigenbaum's Scaling Law for the Logistic Map
Ki-Jung Moon Sensitivity to Initial Conditions for the Logistic Map
Santos Bravo Yuste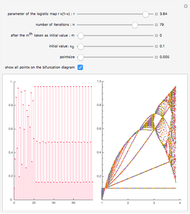 Iterates, Cycles, and Bifurcations of the Logistic Map
Bernard Vuilleumier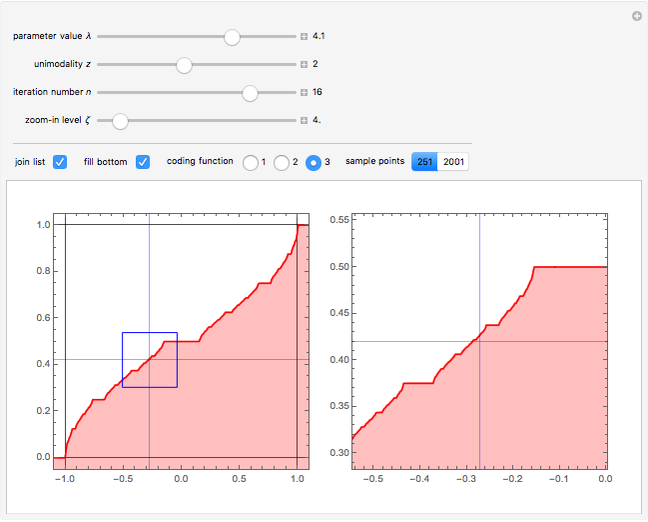 Binary Coding Functions for Generalized Logistic Maps with z-Unimodality
Ki-Jung Moon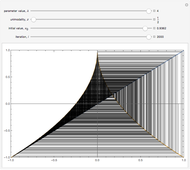 Cobweb Diagram for Generalized Logistic Maps with z-Unimodality
Ki-Jung Moon
