Maximum Likelihood Estimation for Coin Tosses

Requires a Wolfram Notebook System
Interact on desktop, mobile and cloud with the free Wolfram Player or other Wolfram Language products.
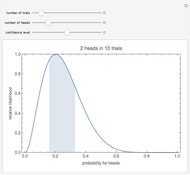
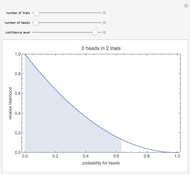
This Demonstration estimates the probability  that a biased coin will come up heads from a series of flips, using the maximum likelihood method. This method estimates from the peak of the plotted curve, which shows the relative likelihood of based on the number of heads observed in the series of flips. The shaded interval represents a 95% confidence interval for the probability. 95% of all confidence intervals constructed in this manner would contain the true value of .
Contributed by: Tad Hogg (July 2008)
Open content licensed under CC BY-NC-SA
Snapshots


Details
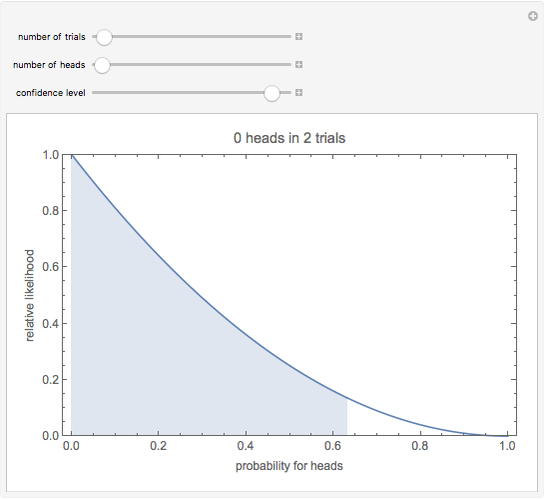
Snapshot 1: Observing no heads in two trials has maximum likelihood estimate  , but with a wide confidence interval: for 95% confidence we can only say the probability is less than 0.63.
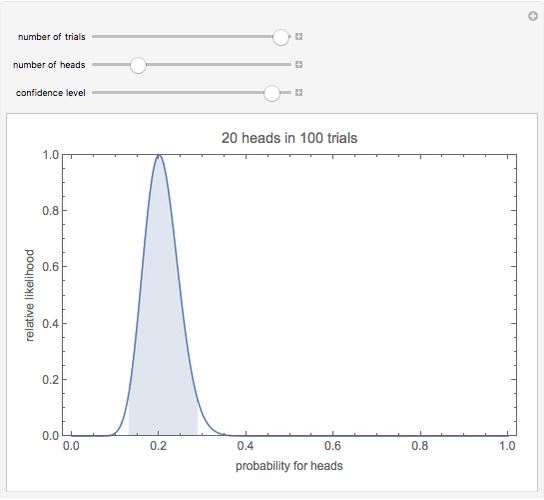
Snapshot 2: Observing 20 heads in 100 trials has maximum likelihood estimate  , the same as observing two heads in 10 trials. But the 95% confidence interval is much smaller: between 0.13 and 0.29.
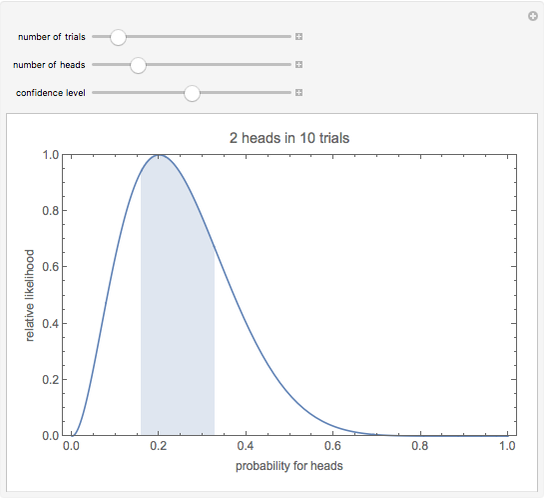
Snapshot 3: Observing two heads in 10 trials shows a narrow confidence interval that corresponds to a low confidence level: the 50% confidence interval is between 0.16 and 0.33.
Flipping a biased coin  times gives
  heads with probability
  , the binomial distribution, where is the probability that a flip gives heads. An unbiased coin has
  .
.
Estimating the probability is the inverse problem: we observe heads in trials and want to determine the unknown probability and the accuracy of the estimate. The maximum likelihood estimate is the value of giving the largest probability for the observed data. Treating the binomial distribution as a function of , this procedure maximizes the likelihood, proportional to  . Viewed as a distribution on the unknown parameter with given values of and , the likelihood is proportional to the beta distribution, with parameters
  and
and  . The maximum of the likelihood occurs at
  . For the plots, the likelihood is normalized so that its largest value is 1.
The confidence interval characterizes the accuracy of the maximum likelihood estimate. For a confidence level  between 0 and 1, the confidence interval gives a range of probabilities that contains the actual value with probability . The interval covers a fraction of the area under the likelihood curve shown in the plot.
The precise choice of confidence interval is somewhat arbitrary. Here the interval excludes equal area tails on each side of the curve's peak (except when  or
or  , in which case the maximum likelihood estimate is 0 or 1, respectively, and the shaded area is a one-sided interval). With this choice for the interval, if the actual probability value is outside the confidence interval, is equally likely to be above or below the displayed interval.
Permanent Citation
 Maximum Likelihood Estimation
Marc Brodie (Wheeling Jesuit University)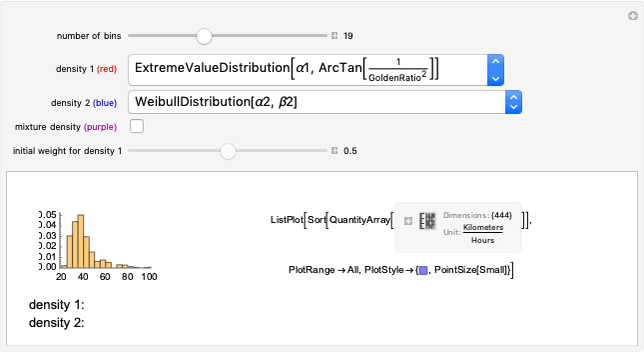 Maximum Likelihood Estimation of Ordinary and Finite Mixture Distributions
Heikki Ruskeepää and M. A. Ghorbani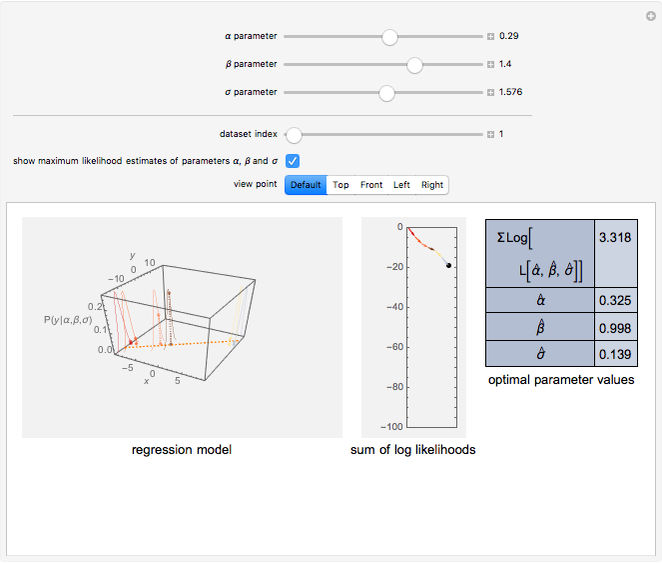 Maximum Likelihood Estimators with Normally Distributed Error
Seth J. Chandler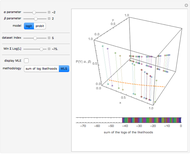 Maximum Likelihood Estimators for Binary Outcomes
Seth J. Chandler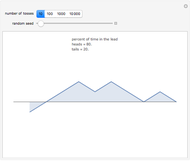 Leads in Coin Tossing
Fiona Maclachlan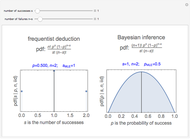 Frequentist versus Bayesian PDF for Binary Decisions Like Coin Tossing, OSHA Compliance, and Jury Trials
James C. Rock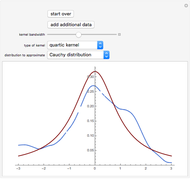 Kernel Density Estimation
Jeff Hamrick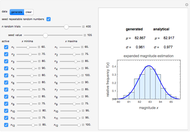 Expanded Magnitude Estimation Method
Mark D. Normand and Micha Peleg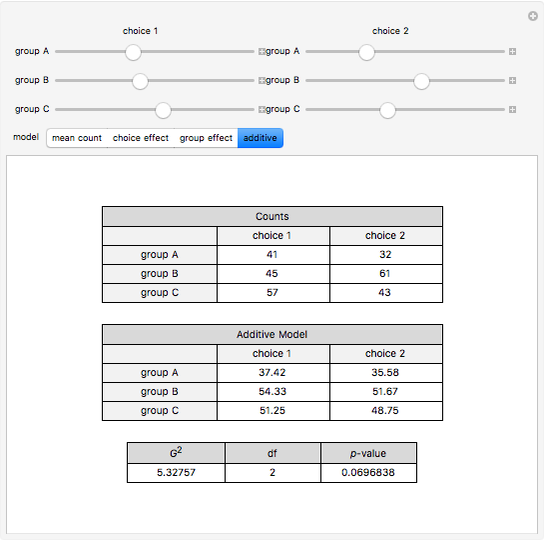 Likelihood-Based Goodness of Fit in Two-Way Contingency Tables
Darren Glosemeyer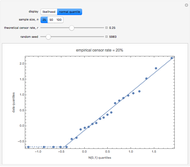 Comparing Exact and Approximate Censored Normal Likelihoods
Ian McLeod and Nagham Muslim Mohammad
-
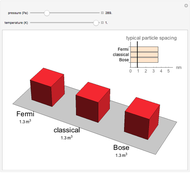 Compressing Ideal Fermi and Bose Gases at Low Temperatures
Tad Hogg -
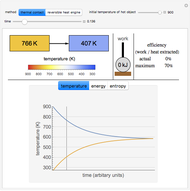 Irreversible and Reversible Temperature Equilibration
Tad Hogg -
 Maximum Likelihood Estimation for Coin Tosses
Tad Hogg -
 Stroop Effect: Reading Colored Words
Tad Hogg -
 Bijective Mapping of an Interval to a Square
Tad Hogg -
 The Multi-Arm Bandit
Tad Hogg -
 Juggling the Cascade Pattern
Tad Hogg -
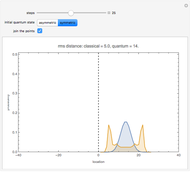 Quantum Random Walk
Tad Hogg -
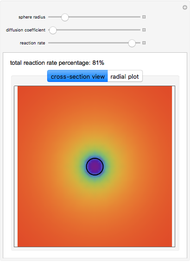 Diffusion to a Spherical Reactor
Tad Hogg -
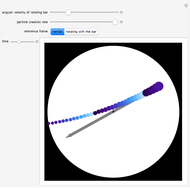 Particles Thrown from a Rotating Bar
Tad Hogg -
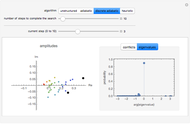
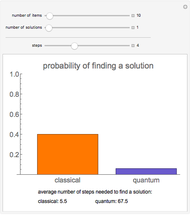 Grover's Quantum Search Algorithm
Tad Hogg -
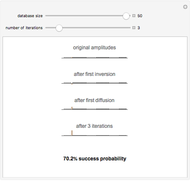 Simulated Quantum Computer Algorithm for Database Searching
Tad Hogg -
 Quantum Computer Search Algorithms
Tad Hogg