Maximum Likelihood Estimators with Normally Distributed Error


Requires a Wolfram Notebook System
Interact on desktop, mobile and cloud with the free Wolfram Player or other Wolfram Language products.
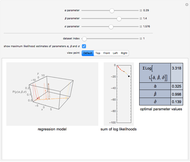
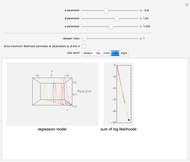
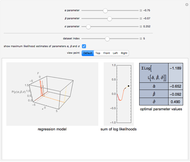
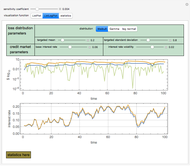
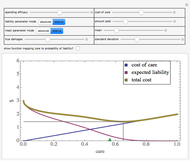
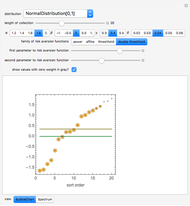
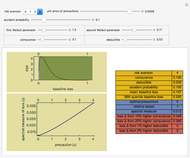
In statistics, there is a frequent desire to develop a model that has, of all models in that class, the maximum likelihood of producing the data observed. This Demonstration shows how to derive the maximum likelihood estimates of the coefficients in a linear model of data ( ) that is believed to have normally distributed error with a standard deviation of a user-set value
  . The top panel shows the data, the current regression model (as an orange line) and the probability (likelihood) that each
  value would occur for a given
  value, given
  and
and  . The bottom panel shows the sum of the logs of each of these likelihoods. Selection of maximum likelihood estimates of and will make this sum as large as possible and the displayed rectangle as small as possible. Curious users can request a computation of the maximum likelihood estimate for each dataset.
Contributed by: Seth J. Chandler (March 2011)
Open content licensed under CC BY-NC-SA
Snapshots


Details
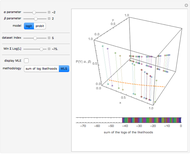
For pedagogical purposes, this Demonstration finds maximum likelihood estimators using a general approach. In specific cases, more efficient and swifter computational methods may exist. In particular, optimal parameter values in the case of normally distributed error can be obtained via linear least-squares optimization; the maximum likelihood estimate of the standard deviation can be obtained as the square root of the mean of the squared residuals. The code underlying this Demonstration permits this swifter but less general methodology to be used.
This Demonstration will be more responsive to movements of the parameter sliders if no computation of the maximum likelihood estimate is requested.
A useful experiment is to set the parameter sliders so that they correspond to the optimal parameter values determined by the computer. Then determine the effect on the sum of the log likelihoods as the σ parameter increases. Then see what happens if you set the α and β parameter sliders to suboptimal levels. Does increasing increase or decrease the sum of the log likelihoods?
Permanent Citation
 Maximum Likelihood Estimators for Binary Outcomes
Seth J. Chandler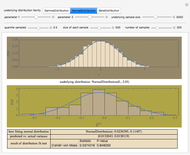 The Sampling Distribution of a Sampling Quantile
Seth J. Chandler Maximum Likelihood Estimation
Marc Brodie (Wheeling Jesuit University) Sports Seasons Based on Score Distributions
Seth J. Chandler Maximum Likelihood Estimation of Ordinary and Finite Mixture Distributions
Heikki Ruskeepää and M. A. Ghorbani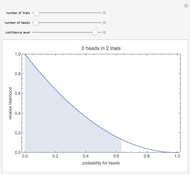 Maximum Likelihood Estimation for Coin Tosses
Tad Hogg Intuitive Parameterization of the Bivariate Normal Distribution
Robert L. Brown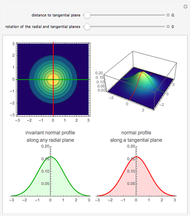 Rotational Symmetry of Multivariate Uncorrelated Standard Normal Distribution
Diego M. Oviedo-Salcedo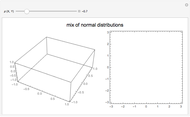 Marginal Normality Does Not Imply Bivariate Normality
Ehsan Azhdari Joint Density of Trivariate Gaussian Random Variables
John M. Shea
-
 Post-Event Bonding
Seth J. Chandler -
 Emulating Land Use Evolution with a Cellular Automaton
Seth J. Chandler -
 General Assembly Resolution Viewer
Seth J. Chandler -
 Random Acyclic Networks
Seth J. Chandler -
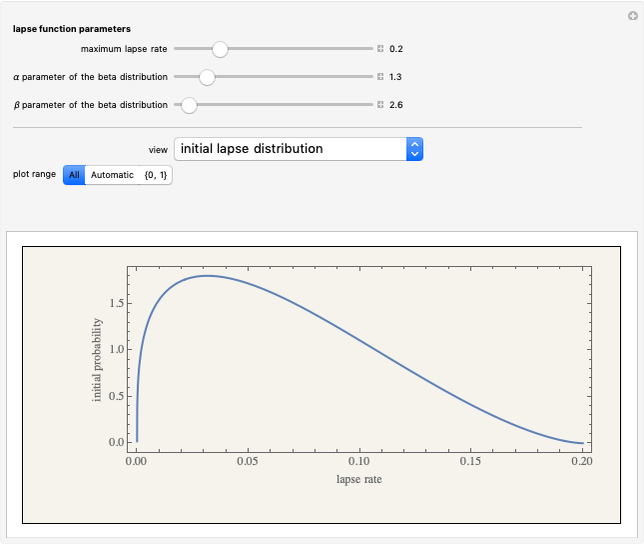 A Theory of Insurance Lapses
Seth J. Chandler -
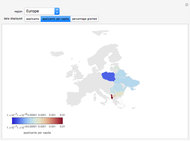 Asylum in the United States
Seth J. Chandler -
 Property Coinsurance
Seth J. Chandler -
 The Persuasion Effect: A Traditional Two-Stage Jury Model
Seth J. Chandler -
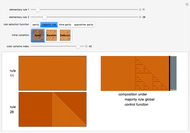 Cellular Automata with Global Control
Seth J. Chandler -
Sports Seasons Based on Score Distributions
Seth J. Chandler -
 Evidentiary Uncertainty
Seth J. Chandler -
 Spectral Measures
Seth J. Chandler -
 The Banzhaf Power Index of States for Presidential Candidates
Seth J. Chandler -
 Liability Insurance Desirability under Lognormal Loss Distributions
Seth J. Chandler -
 The Effects of Coinsurance and Deductibles on Optimal Precautions for Weibull-Distributed Loss
Seth J. Chandler -
 Collocation by Chi Square
Seth J. Chandler -
 The Present Value of Future Gas Use
Seth J. Chandler -
 Visualizing Legal Rules: A Homicide Case
Seth J. Chandler -
 Communities of Nations Bridged by Language Similarity
Seth J. Chandler