Correlation and Regression Explorer


Requires a Wolfram Notebook System
Interact on desktop, mobile and cloud with the free Wolfram Player or other Wolfram Language products.
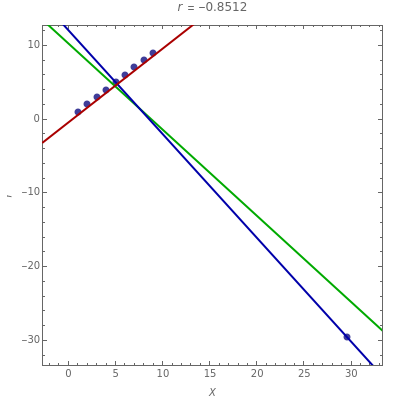
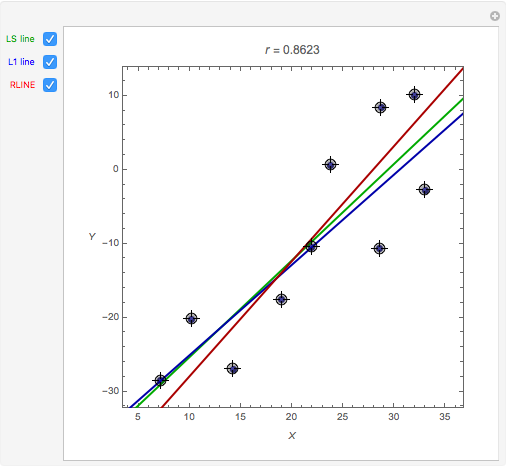
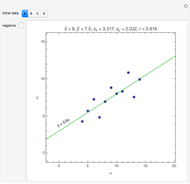
The scatter plot shown is based on an initial data configuration that was called Andrew's example in a lecture by J. W. Tukey that the author attended. Three types of regression lines are available: least squares (LS), least absolute deviation (L1), and a resistant line regression. See the Details section for more information about the regression lines. In Andrew's example, LS, L1, and RLINE all produce very different fits.
[more]


Contributed by: Ian McLeod (The University of Western Ontario) (March 2011)
Open content licensed under CC BY-NC-SA
Snapshots
Details
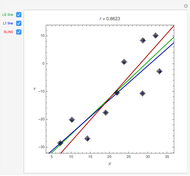
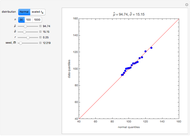
Snapshot 1: the points are similar to data generated from a bivariate normal distribution with correlation coefficient about 0.86
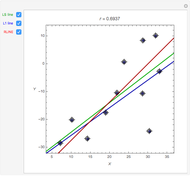
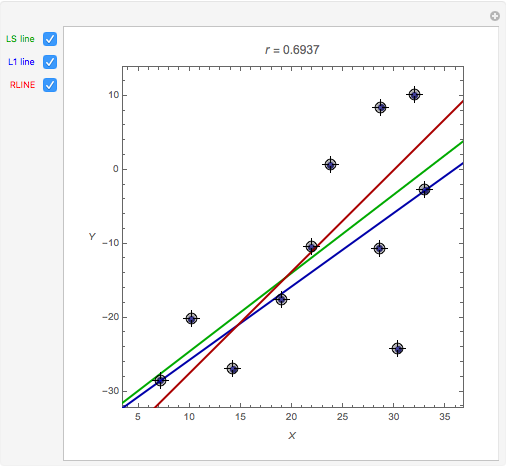
Snapshot 2: the data is the same as in snapshot 1 except a point has been added in the bottom-right corner; the LS regression line slope does not change much but the correlation does
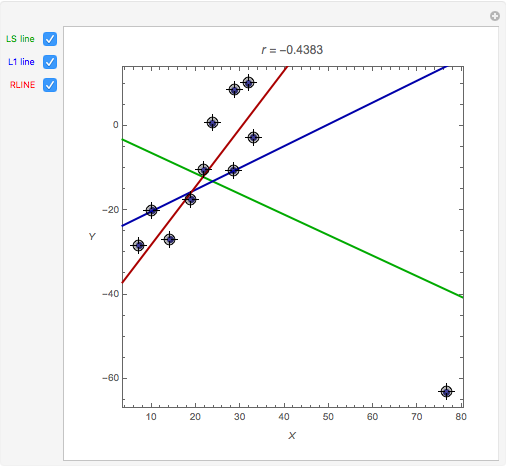
Snapshot 3: same as in snapshot 2 but the point is much further to the right; both correlation and regression lines have completely changed
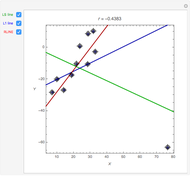
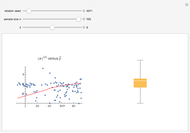
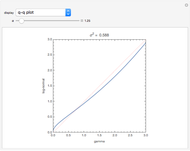
Snapshot 4: five points have been moved to roughly follow a parabolic curve; this illustrates that correlation does not measure nonlinear association
For LS regression, Mathematica's Fit function is used.
L1 regression minimizes the sum of absolute errors. This is computed using linear programming; see eqn. (3) in [2]. L1 regression is more robust than LS when moderate outliers are present, but it is still sensitive to extreme outliers.
RLINE: resistant regression line §5 [3] is based on medians.
[1] F. J. Anscombe, "Graphs in Statistical Analysis," The American Statistician, 27(2), 1973 pp. 17–21.
[2] S. C. Narula and J. F. Wellington, "The Minimum Sum of Absolute Errors Regression: A State of the Art Survey," International Statistical Review, 50(2), 1982 pp. 317–326.
[3] P. F. Velleman and D. C. Hoaglin, Applications, Basics and Computing of Exploratory Data Analysis, Boston: Duxbury Press, 1981.
Permanent Citation
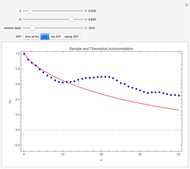
 Spread-Location Regression Diagnostic Check
Ian McLeod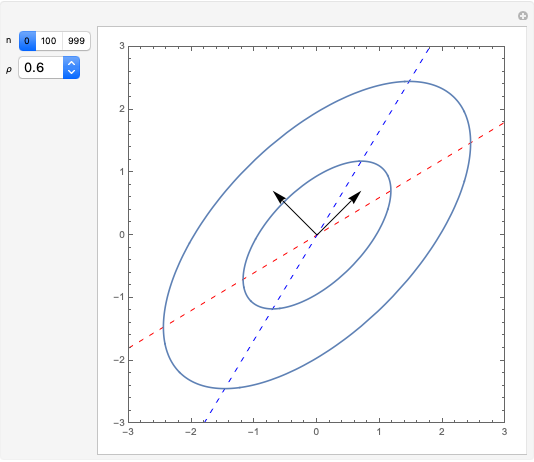 Karhunen-Loeve Directions and Regression
Ian McLeod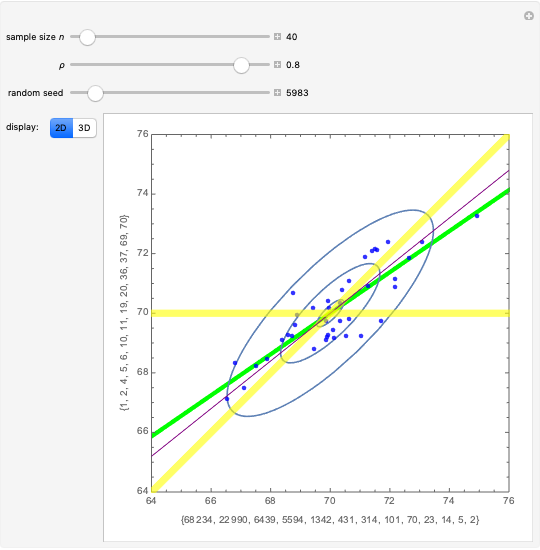 Regression toward the Mean
Ian McLeod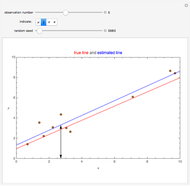 Mean, Fitted-Value, Error, and Residual in Simple Linear Regression
Ian McLeod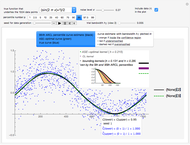 Nonparametric Regression and Kernel Smoothing: Confidence Regions for the L2-Optimal Curve Estimate
Didier A. Girard Hidden Correlation in Regression
Ian McLeod and Yun Shi Local Regression for Country Data
Heikki Ruskeepää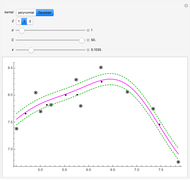 Method of Support Vector Regression
Heikki Ruskeepää Influential Points in Regression
Ian McLeod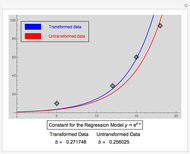 Comparing Regression Models with and without Data Transformation
Vincent Shatlock and Autar Kaw
-
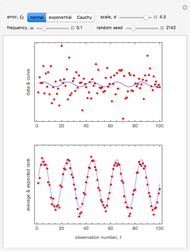 Rank Transform in Harmonic Regression Time Series
Ian McLeod -
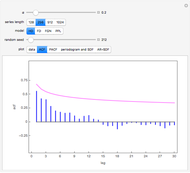
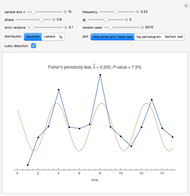 Detecting Periodicity in Short Time Series
Ian McLeod -
 Tempered Fractionally Differenced White Noise
Ian McLeod -
Regression toward the Mean
Ian McLeod -
Spread-Location Regression Diagnostic Check
Ian McLeod -
 Anscombe Quartet
Ian McLeod -
 Visualizing Higher-Dimensional Data with 3D Scatterplots
Ian McLeod -
Mean, Fitted-Value, Error, and Residual in Simple Linear Regression
Ian McLeod -
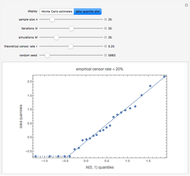
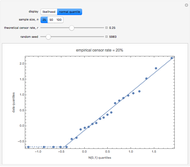
 Estimating and Diagnostic Checking in Censored Normal Random Samples
Ian McLeod -
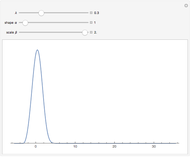
 Comparing Gamma and Log-Normal Distributions
Ian McLeod -
 Monte Carlo Expectation-Maximization (EM) Algorithm
Ian McLeod -
 Comparing Exact and Approximate Censored Normal Likelihoods
Ian McLeod -
 Transformation to Symmetry of Gamma Random Variables
Ian McLeod -
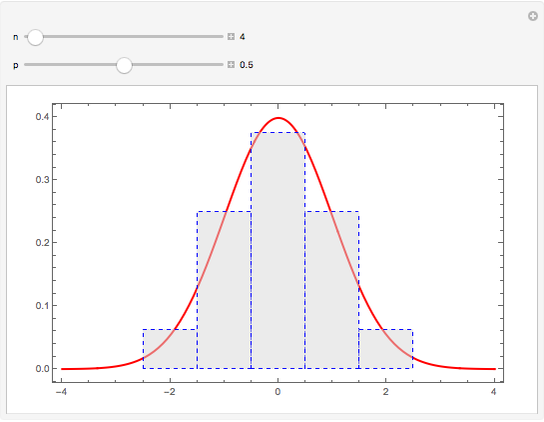 Illustrating the Central Limit Theorem with Sums of Bernoulli Random Variables
Ian McLeod -
Hidden Correlation in Regression
Ian McLeod -
 Informal Power Assessment of the Normal Probability Plot
Ian McLeod -
 Time Series for Power-Law Decay
Ian McLeod -
 Block Bootstrap for Time Series
Ian McLeod -
 Fractional Gaussian Noise
Ian McLeod -
 Plotting a Long Time Series
Ian McLeod