Molecular Electrostatic Potential Maps (MEPs) of Some Polar Molecules

Requires a Wolfram Notebook System
Interact on desktop, mobile and cloud with the free Wolfram Player or other Wolfram Language products.
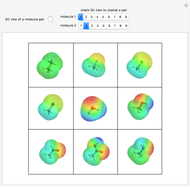
The electrostatic potential surface of a molecule maps its electron density. The surface is colored according to the local electrostatic potential (e.g. red/negative, green/near zero, and blue/positive). Quantum chemistry packages, here B3LYP/6-31G(d), have been used to model the molecules and surface coloring.
[more]
Contributed by: Guenther Gsaller (September 2014)
(Institute of Organic Chemistry, Johannes Kepler University, Linz, Austria)
Open content licensed under CC BY-NC-SA
Snapshots
Details
The molecules shown are
• ethane
• fluoromethane
• chloromethane
• bromomethane
• water
• methanol
• acetaldehyde
• acetic acid
• methylamine
These were imported using their chemical names in Avogadro. Input files were created through the Gaussian extension with
#p B3LYP/6-31G(d) scf=tight formcheck
and z-matrix (compact) [2, 3].
GaussView was used to run the programs. Cubegen generated the density and potential cubes [4].
For each molecule, the fchk file was opened in Avogadro and exported as a mol file.
The density cube file was opened in Chimera with the level set to 0.0004. Then the electrostatic potential-surface was colored by using the corresponding esp cube file. To enable a comparison for all molecules, the same color range was chosen: red=-0.05, ..., blue=0.05. Finally, the resulting graphic was exported as a wrl file [5].
In MeshLab, the meshes are imported and exported as ply files [6].
The Demonstration "Displaying Molecules with Multiple Bonds" by Bianca Eifert makes it possible to show the double-bonds of molecules in Mathematica [7]. Through slightly modifying her code, the modeled molecules of acetaldehyde and acetic acid can be imported as mol files with double-bonds on.
The results are copied to this Demonstration in the initialization code and named meps.
References
[1] E. Anslyn and D. Dougherty, Modern Physical Organic Chemistry, Sausalito: University Science Books, 2006.
[2] M. Hanwell, D. Curtis, D. Lonie, T. Vandermeersch, E. Zurek, and G. Hutchison, "Avogadro: An Advanced Semantic Chemical Editor, Visualization, and Analysis Platform," Journal of Chemoinformatics, 4(17), 2004 pp. 1758–2946. doi:10.1186/1758-2946-4-17.
[3] "Molecular Electrostatic Potential (MEP)." (Sep 2, 2014) www.cup.uni-muenchen.de/oc/zipse.
[4] Gaussian 09, Revision D.01, Wallingford, CT: Gaussian, Inc., 2009.
[5] E. Pettersen, T. Goddard, C. Huang, G. Couch, D. Greenblatt, E. Meng, and T. Ferrin, "UCSF Chimera - A Visualization System for Exploratory Research and Analysis," Journal of Computational Chemistry, 25, 2004 pp. 1605–1612. doi:10.10.1002/jcc.20084.
[6] "MeshLab." (Sep 2, 2014) meshlab.sourceforge.net.
[7] B. Eifert. "Displaying Molecules with Multiple Bonds" from the Wolfram Demonstrations Project—A Wolfram Web Resource. demonstrations.wolfram.com/DisplayingMoleculesWithMultipleBonds.
Permanent Citation
"Molecular Electrostatic Potential Maps (MEPs) of Some Polar Molecules"
http://demonstrations.wolfram.com/MolecularElectrostaticPotentialMapsMEPsOfSomePolarMolecules/
Wolfram Demonstrations Project
Published: September 16 2014


