The Perfect Venn Diagram


Requires a Wolfram Notebook System
Interact on desktop, mobile and cloud with the free Wolfram Player or other Wolfram Language products.
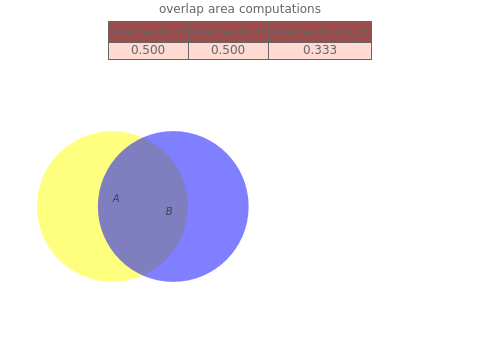
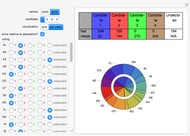
A Venn diagram is commonly used to depict the relationship among sets. It is difficult, however, to draw freehand a Venn diagram that accurately captures a relationship between the cardinality of the sets and their area of overlap. This Demonstration produces the "perfect" Venn diagram for two sets  and
and  where you set the cardinality ratio between the two sets and the area of overlap between them. You can choose whether to compute the area of overlap relative to or to .
Contributed by: Seth J. Chandler (March 2011)
Additional contributions by: Eric W. Weisstein
Open content licensed under CC BY-NC-SA
Snapshots


Details
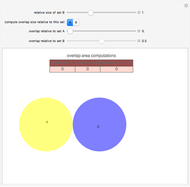
Snapshot 1: two disjoint sets
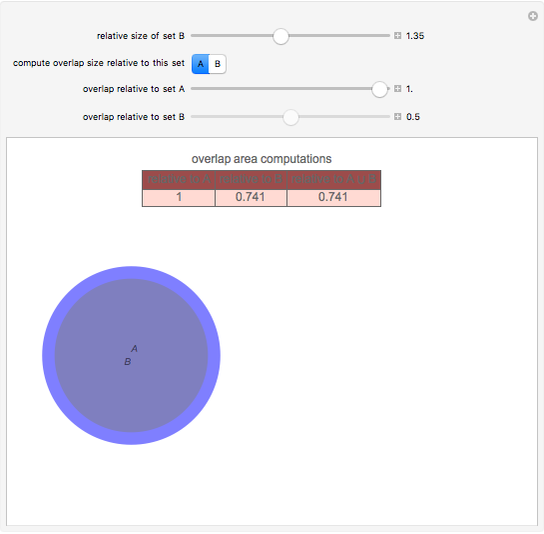
Snapshot 2: is a subset of
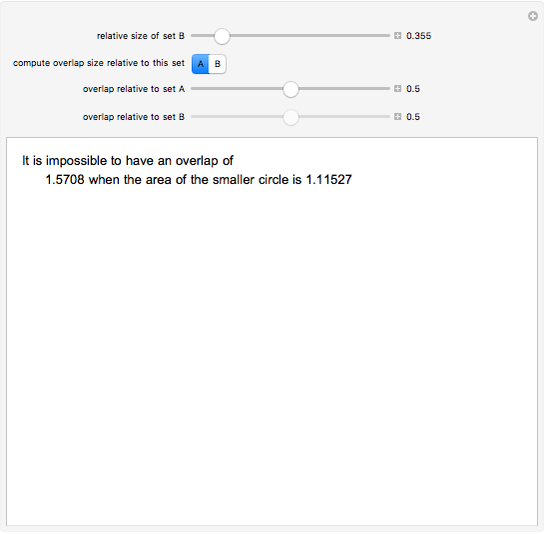
Snapshot 3: handling a situation where the desired overlap is impossibly large
Permanent Citation
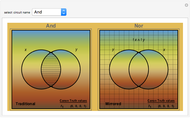 Venn Diagrams for Two-Variable Boolean Logic Circuits
Lawrence J. Thaden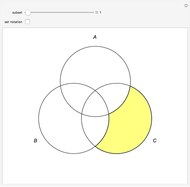 Venn Diagrams
George Beck and Liz Kent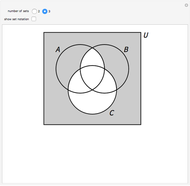 Interactive Venn Diagrams
Marc Brodie (Wheeling Jesuit University)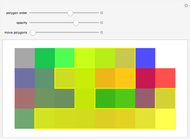 The Chow-Ruskey Order 5 Venn Diagram
Ed Pegg Jr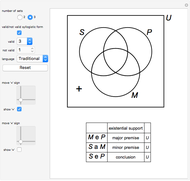 Venn Diagrams and Syllogisms
Izidor Hafner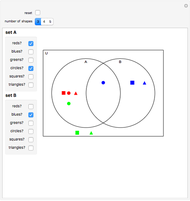 Venn Diagrams for Two Sets
Olivia M. Carducci (East Stroudsburg University)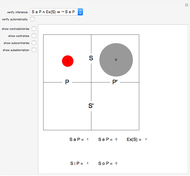 Lewis Carroll's Bilateral Diagram
Izidor Hafner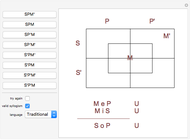 Lewis Carroll's Diagram and Categorical Syllogisms
Izidor Hafner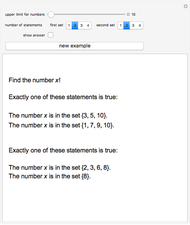 Some Simple Logic Problems
Izidor Hafner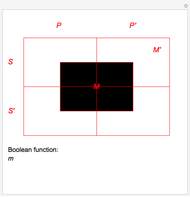 Lewis Carroll's Diagrams
Izidor Hafner
-
 Post-Event Bonding
Seth J. Chandler -
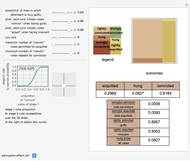
 Emulating Land Use Evolution with a Cellular Automaton
Seth J. Chandler -
 General Assembly Resolution Viewer
Seth J. Chandler -
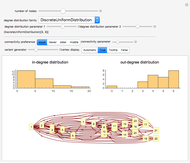 Random Acyclic Networks
Seth J. Chandler -
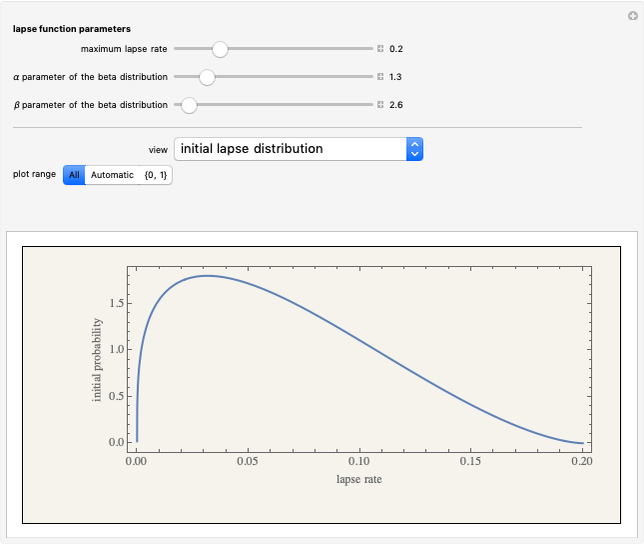 A Theory of Insurance Lapses
Seth J. Chandler -
 Asylum in the United States
Seth J. Chandler -
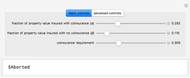 Property Coinsurance
Seth J. Chandler -
 The Persuasion Effect: A Traditional Two-Stage Jury Model
Seth J. Chandler -
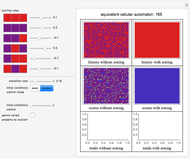
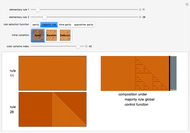 Cellular Automata with Global Control
Seth J. Chandler -
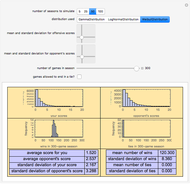 Sports Seasons Based on Score Distributions
Seth J. Chandler -
 Evidentiary Uncertainty
Seth J. Chandler -
 Spectral Measures
Seth J. Chandler -
 The Banzhaf Power Index of States for Presidential Candidates
Seth J. Chandler -
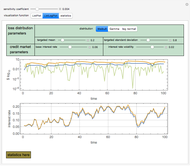
 Liability Insurance Desirability under Lognormal Loss Distributions
Seth J. Chandler -
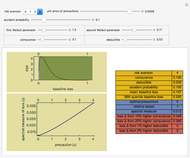 The Effects of Coinsurance and Deductibles on Optimal Precautions for Weibull-Distributed Loss
Seth J. Chandler -
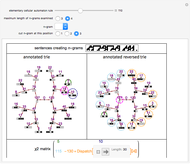 Collocation by Chi Square
Seth J. Chandler -
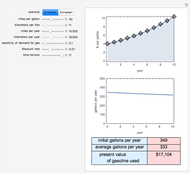 The Present Value of Future Gas Use
Seth J. Chandler -
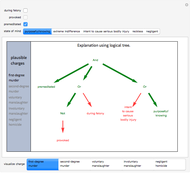 Visualizing Legal Rules: A Homicide Case
Seth J. Chandler -
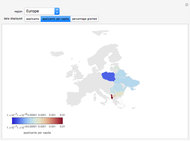
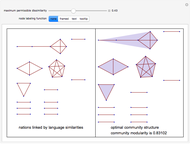 Communities of Nations Bridged by Language Similarity
Seth J. Chandler