Bifurcation Diagrams with Flow Fields


Requires a Wolfram Notebook System
Interact on desktop, mobile and cloud with the free Wolfram Player or other Wolfram Language products.
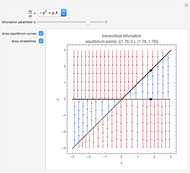
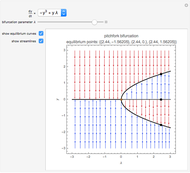
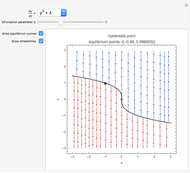
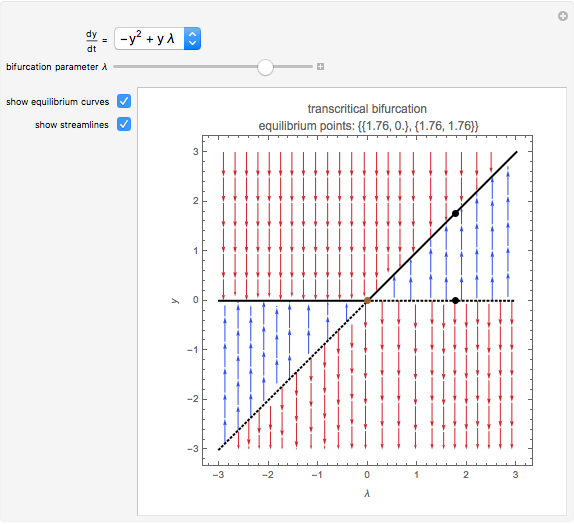
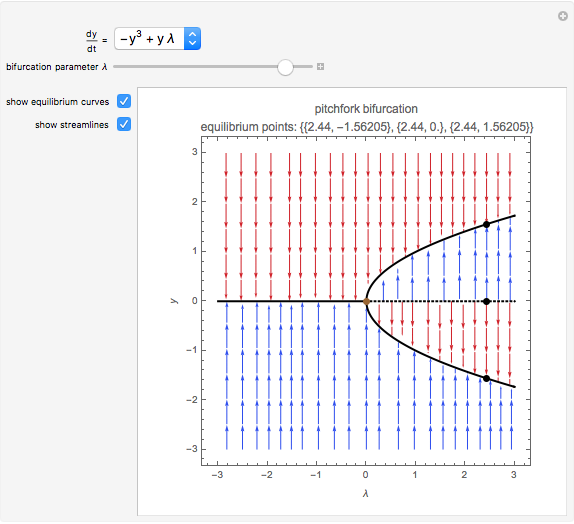
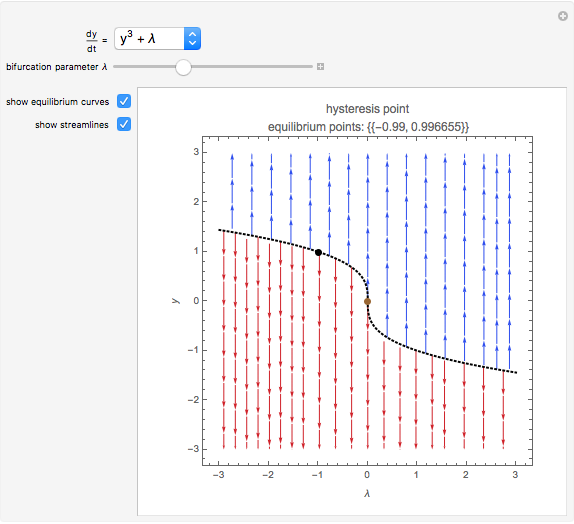
Bifurcations indicate qualitative changes in a system's behavior. For a dynamical system  , bifurcation points are those equilibrium points at which the Jacobian
  is singular. This Demonstration shows the bifurcation diagrams of several normal form bifurcations in one dimension. The bifurcation point, equilibrium points, and the flow of the vector field are visualized. The bifurcation is shown as a brown point. Solid black lines indicate stable equilibrium branches and dashed black lines indicate unstable ones.
Contributed by: Suba Thomas (March 2011)
Open content licensed under CC BY-NC-SA
Snapshots
Details
R. Seydel, Practical Bifurcation and Stability Analysis: From Equilibrium to Chaos, New York: Springer-Verlag, 1994.
Permanent Citation
"Bifurcation Diagrams with Flow Fields"
http://demonstrations.wolfram.com/BifurcationDiagramsWithFlowFields/
Wolfram Demonstrations Project
Published: March 7 2011
 Phase Portrait and Field Directions of Two-Dimensional Linear Systems of ODEs
Santos Bravo Yuste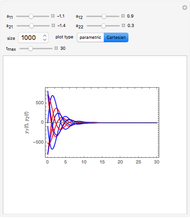 Visualizing the Solution of Two Linear Differential Equations
Mikhail Dimitrov Mikhailov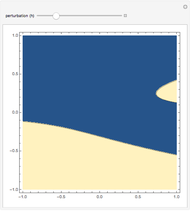 Effect of a Perturbation on the Stable Points of a Dynamical System
Andrew Read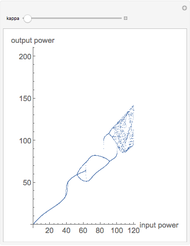 Bifurcation Diagram for a Simple Nonlinear Optical Fiber Ring Resonator
Stephen Lynch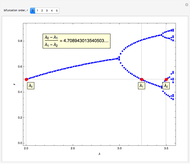 Feigenbaum's Scaling Relation for Superstable Parameter Values: "Bifurcation Diagram Helper"
Ki-Jung Moon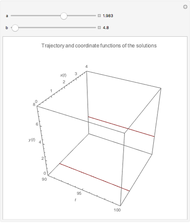 Hopf Bifurcation in the Brusselator
Judit Várdai and János Tóth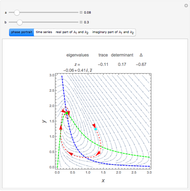 Hopf Bifurcations in a Nonlinear Two-Dimensional Autonomous System
Housam Binous, Ahmed Bellagi, and Brian G. Higgins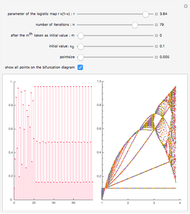 Iterates, Cycles, and Bifurcations of the Logistic Map
Bernard Vuilleumier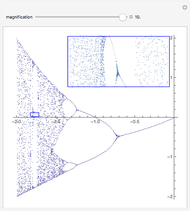 Orbit Diagram of the Logistic Map
Ed Pegg Jr Dynamics of a Charged Particle in a Magnetic Field with a Kicked Electric Field
Enrique Zeleny