Line Jaggedness Visualization with the Mandelbrot-Weierstrass Function

Requires a Wolfram Notebook System
Interact on desktop, mobile and cloud with the free Wolfram Player or other Wolfram Language products.
This Demonstration helps visualize the effect of resolution and the apparent fractal dimension on the jaggedness of an irregular line.
Contributed by: Mark D. Normand and Micha Peleg (March 2011)
Open content licensed under CC BY-NC-SA
Snapshots

Details
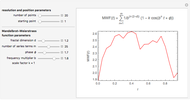
Snapshot 1: moderately jagged line at low resolution
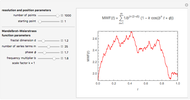
Snapshot 2: moderately jagged line at high resolution
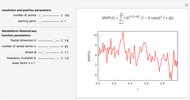
Snapshot 3: highly jagged line at low resolution
Snapshot 4: highly jagged line at high resolution
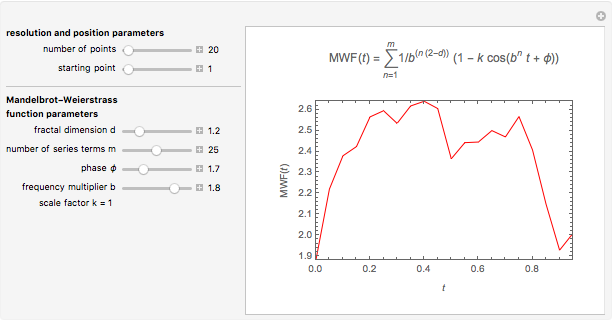
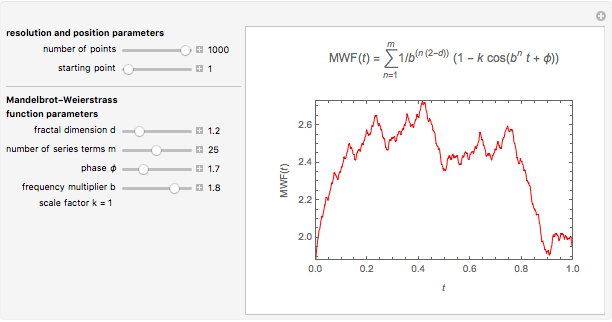
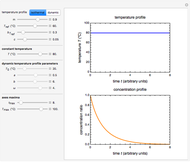
This Demonstration helps the user to visualize the jaggedness of an irregular line, time series, or signature by allowing its generation at different apparent fractal dimensions (in the range 1 to 2) using the Mandelbrot–Weierstrass function as the model. The function is displayed above the plot. The values of four of the function's five parameters  ,
,  ,
,  , and
, and  are set using sliders while
  is fixed at 1;
  is the apparent fractal dimension,
  is the number of terms computed from the infinite series,
  is the phase,
  is the frequency multiplier, and
  is the scale factor. The number of generated points, which determines the resolution and the starting point in the plot, is also entered with sliders. You can create plots of controlled jaggedness and resolution whose morphology is different in detail. This highlights the roles of the mathematical jaggedness as represented by the fractal dimension and the resolution that in real plots is determined by practical considerations.
References:
R. S. Pande, A. Jalgaonkar, and R. M. Patrikar, "A 3-D FEM Based Extractor for MEMS Inductor with Monte-Carlo Sampling," in Physics of Semiconductor Devices, IEEE Explore, 2007 pp. 710–713.
J. C. Russ, Fractal Surfaces, New York: Plenum Press, 1994 pp. 27–57.
M. Peleg, "Line Jaggedness Measures and Their Applications in Textural Evaluation of Foods," Critical Reviews in Food Science and Nutrition, 37, 1997 pp. 491–518.
 Fractals Generated by the Weierstrass P Function
Enrique Zeleny Fractals Generated by Jacobi Theta Functions
Enrique Zeleny Fractal Cellular Textures
Arnie Cachelin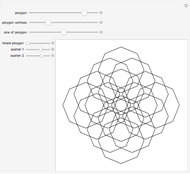 Fractal Polygon Tiler
Sándor Kabai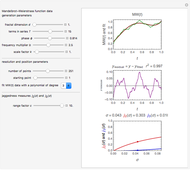 Comparing Measures of Line Jaggedness
Mark D. Normand and Micha Peleg Julia Sets and the Mandelbrot Set
Mark McClure Dust with Line Shadows in Every Direction
Jaime Rangel-Mondragon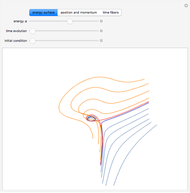 Weierstrass Solution of Cubic Anharmonic Oscillation
Brad Klee Dirichlet L-Functions near the Critical Line
Roger Germundsson and Charles Pooh PolyLog Function
Enrique Zeleny
-
 Ratkowski's Square Root Growth Rate Model for High Temperatures
Micha Peleg -
 Gordon-Taylor and Fox Equations for Glass Transition Temperature
Micha Peleg -
 Force to Overcome Vacuum Pull
Micha Peleg -
 Extending the Square Root Growth Rate Model to Lethal Low Temperatures
Micha Peleg -
 Probability of Being Strange According to Paulos
Micha Peleg -
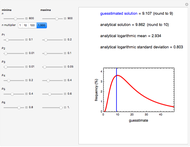
 Successive Three-Point Method for Weibullian Chemical Degradation
Micha Peleg -
 Estimating Cohesion and Tensile Strength of Compacted Powders
Micha Peleg -
 Three-Endpoints Method for Isothermal Weibullian Chemical Degradation
Micha Peleg -
 Vitamin C Loss in Foods During Heat Processing and Storage
Micha Peleg -
 Parameterizing Temperature-Viscosity Relations
Micha Peleg -
 Laplace Distribution in Fluctuating Stock Index Records
Micha Peleg -
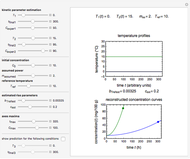
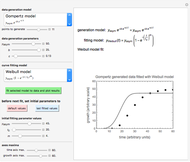
 Weibullian Chemical Degradation
Micha Peleg -
 Simulating Ascorbic Acid Degradation
Micha Peleg -
 Additive and Multiplicative Risks
Micha Peleg -
 Endpoints Method for Predicting Chemical Degradation in Frozen Foods
Micha Peleg -
 Exponential Model for Arrhenius Activation Energy
Micha Peleg -
 Prediction of Isothermal Degradation by the Endpoints Method
Micha Peleg -
 Risk Guesstimation from Factor Ranges
Micha Peleg -
 Volatiles Formation Kinetics in Stored Fish
Micha Peleg -
 Comparison of Six Sigmoid Growth Curve Models
Micha Peleg