Volatiles Formation Kinetics in Stored Fish


Requires a Wolfram Notebook System
Interact on desktop, mobile and cloud with the free Wolfram Player or other Wolfram Language products.
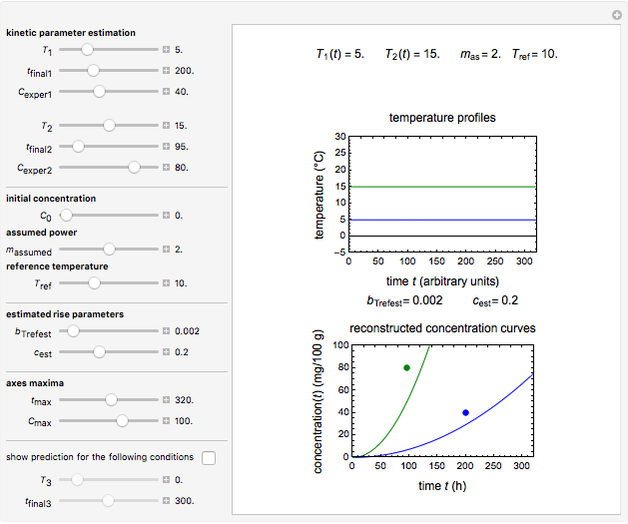
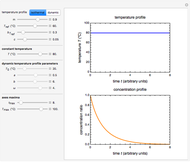
Microbial spoilage of stored fresh fish is accompanied by noxious volatiles formation. The rising concentration of trimethylamine (TMA) and/or total volatile basic nitrogen (TVBN) is described by an empirical power-law model. This model can be used to estimate the spoilage kinetic parameters from the TMA and TVBN initial concentrations and after storage at two constant storage temperatures with the endpoints method. Once determined by matching the two experimental endpoints with their corresponding reconstructed concentration versus time curves using sliders, these kinetic parameters can be used to predict entire TMA and TVBN formation curves at other temperatures.
Contributed by: Mark D. Normand and Micha Peleg (January 2016)
Open content licensed under CC BY-NC-SA
Snapshots

Details
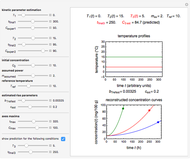
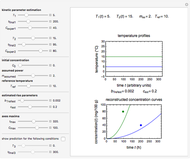
Snapshot 1: the reconstructed TVBN formation curves of the two endpoints shown in the thumbnail
Snapshot 2: a predicted TVBN formation curve at a third temperature calculated from the two endpoints shown in snapshot 1
Snapshot 3: two entered hypothetical TMA experimental endpoints at two temperatures
Snapshot 4: the reconstructed TMA formation curves of the two endpoints shown in snapshot 3
Snapshot 5: a predicted TMA formation curve at a third temperature calculated from the two endpoints shown in snapshot 4
Microbial spoilage of fresh fish at ambient temperatures or in refrigerated storage produces a characteristic repulsive off-odor. Chemical determination of the concentration of volatiles such as trimethylamine (TMA) and/or of the total volatile biological nitrogen (TVBN) is faster than determining the microbial count, and hence can be used as an alternative to monitor fish freshness and determine their shelf life. Frequently, plots of the TMA and TVBN concentration vs. time during fish fillets' isothermal storage have a typical shape [1, 2]. It can be described by the empirical power-law model 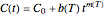 , where
  is the momentary concentration, usually expressed as mg/100g;
  the initial concentration in the same units, which can be zero;
  a temperature-dependent "rate parameter" that is characteristic to the fish species and influenced by any pre-treatment it might have received, e.g. added antibiotic or partial dehydration;
  is the time in hours or days; and
  is a dimensionless "shape characteristic parameter", usually a weak function of temperature that can be assumed constant,
  , as first approximation.
It is assumed that the temperature dependence of the rate parameter follows the exponential model 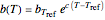 , a simpler substitute for the traditional Arrhenius equation [3–5], where
  is the rate parameter’s value at an arbitrary reference temperature in the pertinent range, and
  a constant having temperature reciprocal units. All temperatures are in °C.
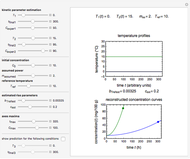
The traditional database to extract kinetic parameters has been a set of experimentally determined concentration versus time curves at different constant temperatures, which requires considerable effort and time. It has been shown that much of this effort can be saved by determining only the endpoints of such curves and using them to calculate the kinetic parameters by numerically solving triplets or pairs of algebraic or differential equations [3–5]. The method, however, has only been applied to microbial survival and chemical degradation—that is, to decay processes where the measured quantity continuously declines. In this Demonstration we apply the endpoints method to fish spoilage kinetics when monitored by following the rise of the TMA or TVBN concentration. With the above model and a fixed shape parameter  , this translates to the pair of simultaneous equations
  and
and  , where is defined by the exponential model and and are the two unknowns. In this Demonstration the two equations are solved graphically, rather than guessing the parameter values.
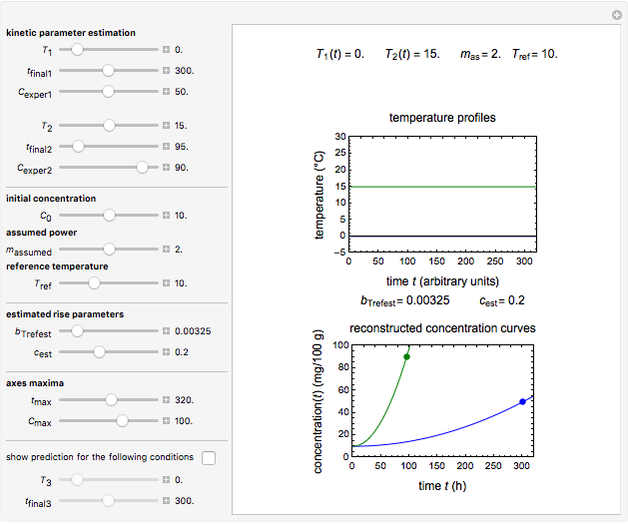
To start the and calculations, enter the two experimentally determined or contemplated TMA or TVBN concentrations and corresponding temperatures and times with sliders. Similarly entered are the known initial concentration , the assumed power  , and a chosen reference temperature
  , in the neighborhood of
  and
and  .
.
To estimate the unknown kinetic parameters and , move their sliders until the two reconstructed curves generated with the model pass through the two endpoints. The sliders’ positions when the curves and endpoints match mark these parameters’ values, which are also displayed above the bottom plot for clarity.
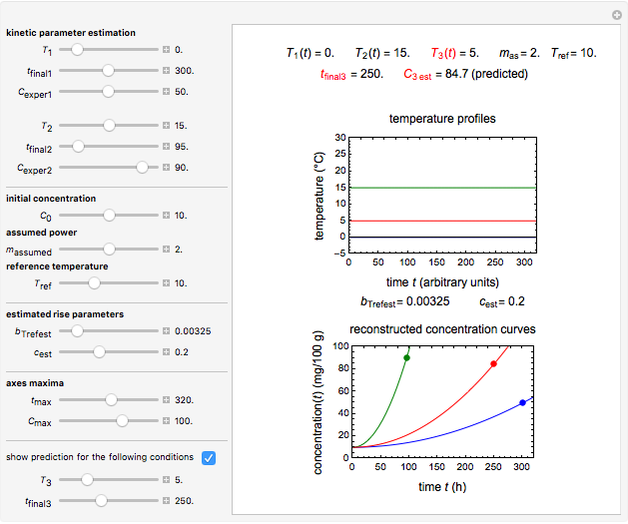
Once obtained in this way, these kinetic parameters can be used to predict the two volatiles’ formation curve at a chosen third temperature by checking the "show prediction for the following conditions" box and setting the positions of the corresponding temperature  and time
  sliders’ positions. The predicted curve and TMA or TVBN concentration are displayed in red.
Note that not all entered endpoints that the program allows have corresponding and values.
References
[1] K. Koutsoumanis and G.-J. E. Nychas, "Application of a Systematic Experimental Procedure to Develop a Microbial Model for Rapid Fish Shelf Life Predictions," International Journal of Food Microbiology, 60(2–3), 2000 pp. 171−184.
[2] T. N. Tsironi and P. S. Taoukis, "Modeling Microbial Spoilage and Quality of Gilthead Seabream Fillets: Combined Effect of Osmotic Pretreatment, Modified Atmosphere Packaging, and Nisin on Shelf Life," Journal of Food Science, 75(4), 2010 pp. M243–M251.
[3] M. Peleg, M. D. Normand, and A. D. Kim, "Estimating Thermal Degradation Kinetics Parameters from the Endpoints of Non-isothermal Heat Processes or Storage," Food Research International, 66, 2014 pp. 313–324.
[4] M. Peleg, A. D. Kim, and M. D. Normand, "Predicting Anthocyanins' Isothermal and Non-isothermal Degradation with the Endpoints Method," Food Chemistry, 187, 2015 pp. 537–544.
[5] M. Peleg, M. D. Normand, and T. R Goulette, "Calculating the Degradation Kinetic Parameters of Thiamine by the Isothermal Version of the Endpoints Method," Food Research International, 79, 2016 pp. 73–80.
Permanent Citation
 Simulating Ascorbic Acid Degradation
Mark D. Normand and Micha Peleg Eyring-Polanyi versus Exponential Model for Chemical Reactions
Mark D. Normand, Christina S. Barsa, and Micha Peleg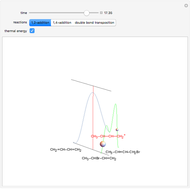 Kinetic and Thermodynamic Control of Electrophilic Addition Reactions
D. Meliga and S. Z. Lavagnino Fit of First-Order Kinetic Model in Degradation Processes
Mark D. Normand and Micha Peleg Extracting Fixed-Order Degradation Kinetics by the Endpoints Method
Mark D. Normand and Micha Peleg Vitamin C Loss in Foods During Heat Processing and Storage
Mark D. Normand and Micha Peleg Failure Probabilities from Quality Control Charts
Mark D. Normand and Micha Peleg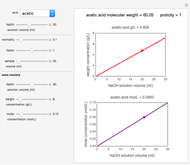 Titration of Common Food Acids
Amy D. Kim, Mark D. Normand, and Micha Peleg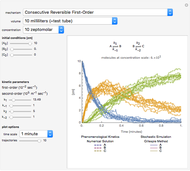 Deterministic versus Stochastic Chemical Kinetics
Brian M. Frezza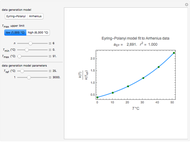 Arrhenius versus Eyring-Polanyi Model
Mark D. Normand and Micha Peleg
-
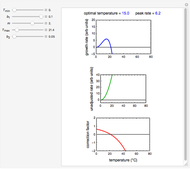 Ratkowski's Square Root Growth Rate Model for High Temperatures
Micha Peleg -
 Gordon-Taylor and Fox Equations for Glass Transition Temperature
Micha Peleg -
 Force to Overcome Vacuum Pull
Micha Peleg -
 Extending the Square Root Growth Rate Model to Lethal Low Temperatures
Micha Peleg -
 Probability of Being Strange According to Paulos
Micha Peleg -
 Successive Three-Point Method for Weibullian Chemical Degradation
Micha Peleg -
 Estimating Cohesion and Tensile Strength of Compacted Powders
Micha Peleg -
 Three-Endpoints Method for Isothermal Weibullian Chemical Degradation
Micha Peleg -
Vitamin C Loss in Foods During Heat Processing and Storage
Micha Peleg -
 Parameterizing Temperature-Viscosity Relations
Micha Peleg -
 Laplace Distribution in Fluctuating Stock Index Records
Micha Peleg -
 Weibullian Chemical Degradation
Micha Peleg -
Simulating Ascorbic Acid Degradation
Micha Peleg -
 Additive and Multiplicative Risks
Micha Peleg -
 Endpoints Method for Predicting Chemical Degradation in Frozen Foods
Micha Peleg -
 Exponential Model for Arrhenius Activation Energy
Micha Peleg -
 Prediction of Isothermal Degradation by the Endpoints Method
Micha Peleg -
 Risk Guesstimation from Factor Ranges
Micha Peleg -
 Volatiles Formation Kinetics in Stored Fish
Micha Peleg -
 Comparison of Six Sigmoid Growth Curve Models
Micha Peleg