Two Geometric Views of Newton's Method
Initializing live version


Requires a Wolfram Notebook System
Interact on desktop, mobile and cloud with the free Wolfram Player or other Wolfram Language products.
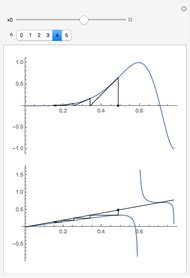
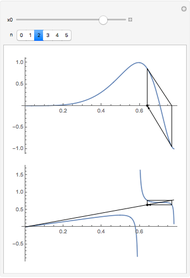
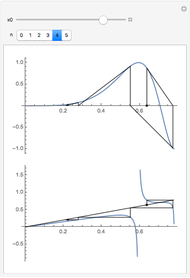
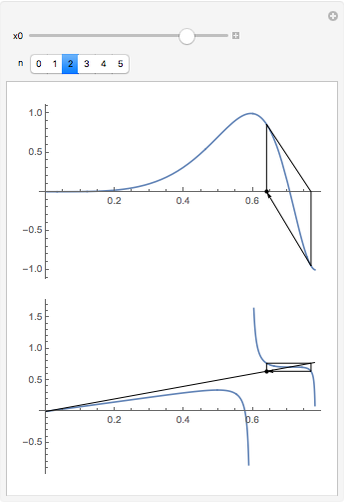
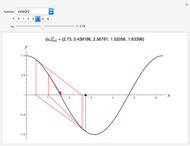
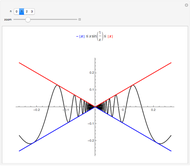
The top plot shows the usual geometric picture of Newton's method for finding an approximate solution to  . Starting with an initial guess,
  , move down the tangent until you hit the
  axis, then calculate a new tangent line and repeat
  times. The bottom plot is a cobweb plot for
  . This illustrates that Newton's method composes
  with itself
  times starting with
  .
.
Contributed by: Bruce Atwood (March 2011)
Open content licensed under CC BY-NC-SA
Snapshots


Details
Permanent Citation
Related Demonstrations
More by Author
 Learning Newton's Method
Angela Sharp, Chad Pierson, and Joshua Fritz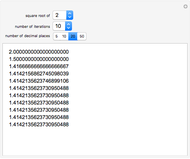 Square Roots with Newton's Method
Jon Mormino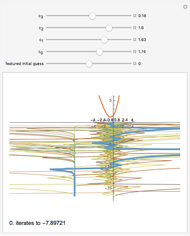 Newton's Method on a Mesh of Initial Guesses
Ken Levasseur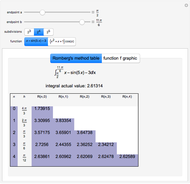 Numerical Integration: Romberg's Method
Eugenio Bravo Sevilla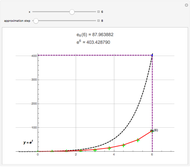 Euler's Method for the Exponential Function
Arnaud Crouzet Numerical Methods for Differential Equations
Edda Eich-Soellner Global and Local Errors in Runge-Kutta Methods
Luis Rández Comparing Leapfrog Methods with Other Numerical Methods for Differential Equations
Ulrich Mutze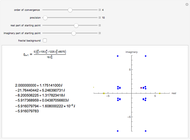 Convergence of Newton's Method for Approximating Square Roots
Andrzej Kozlowski Two-Dimensional Integrals Using the Monte Carlo Method
Housam Binous, Brian G. Higgins, and Ahmed Bellagi
-
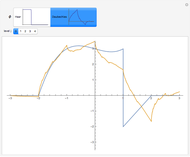
 Trigonometric Fitting and Interpolation
Bruce Atwood -
 Balancing a Can on Its Edge
Bruce Atwood -
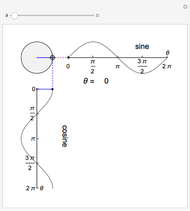 Spinning Out Sine and Cosine
Bruce Atwood -
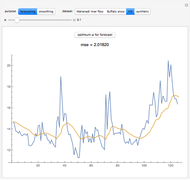 Forecasting with Exponential Moving Averages
Bruce Atwood -
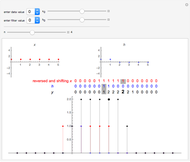 Convolution Sum
Bruce Atwood -
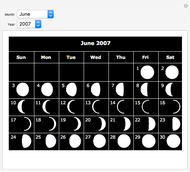 Lunar Calendar Maker
Bruce Atwood -
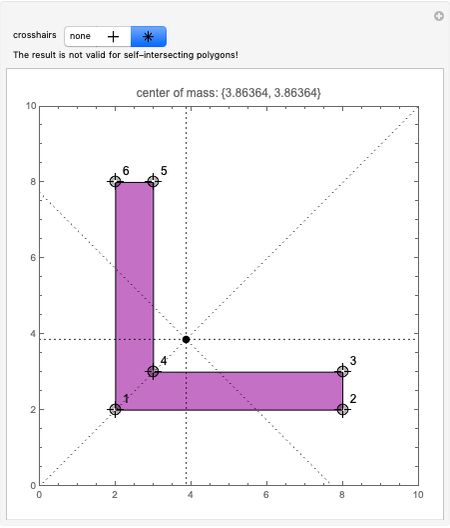 Center of Mass of a Polygon
Bruce Atwood -
 Projection into Spaces Generated by Haar and Daubechies Scaling Functions
Bruce Atwood -
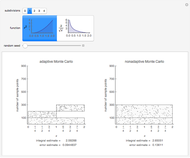 Adaptive Monte Carlo Integration
Bruce Atwood -
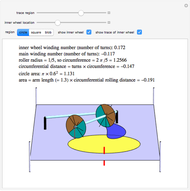 The Polar Planimeter
Bruce Atwood -
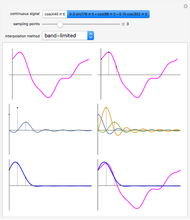 Reconstructing a Sampled Signal Using Interpolation
Bruce Atwood -
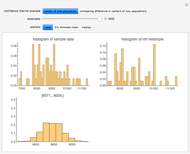 Bootstrap Percentile Confidence Intervals
Bruce Atwood -
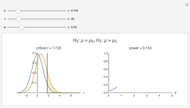 Power Curve of a Mean Test
Bruce Atwood -
 Approximating Continuous Functions with Haar Approximations
Bruce Atwood -
 Sliding to the Fermat Point
Bruce Atwood -
 Wavelet Shrinkage Denoising
Bruce Atwood -
 Filling a Container Defined by a Curve
Bruce Atwood -
 Squeeze Theorem
Bruce Atwood -
 Signed Area of a Polygon
Bruce Atwood -
 Bézier Curve by de Casteljau's Algorithm
Bruce Atwood