Compressibility Factor Charts


Requires a Wolfram Notebook System
Interact on desktop, mobile and cloud with the free Wolfram Player or other Wolfram Language products.
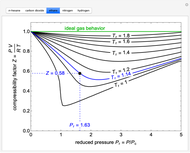
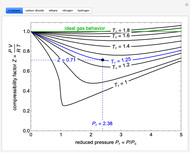
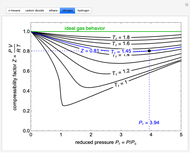
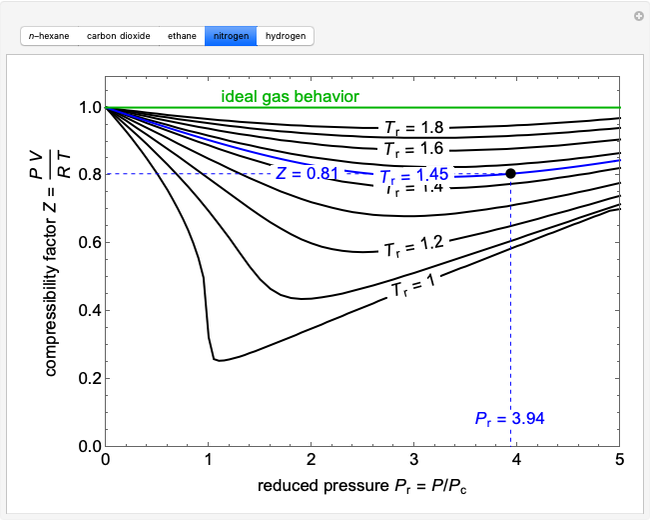
The compressibility factor chart plots the compressibility factor  , equal to
  , where
  is the volume per mole, versus the reduced pressure
  for several values of the reduced temperature
  . The reduced pressure and temperature are defined by
  and
and  , respectively, where
  is the critical pressure and
  is the critical temperature. Use buttons to select one of five molecules, and move the black dot to display the compressibility factor curve (blue) for any value of
  between 1.0 and 1.8. The
  and
and  values for the location of the black dot are displayed on the chart. For an ideal gas,
  (green line).
Contributed by: Rachael L. Baumann (May 2017)
Additional contributions by: John L. Falconer
(University of Colorado Boulder, Department of Chemical and Biological Engineering)
Open content licensed under CC BY-NC-SA
Snapshots


Details
The Soave modification of the Redlich–Kwong (SRK) equation of state is used to calculate the compressibility factor:
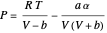 .
.
This equation can be written in terms of the reduced temperature  :
:
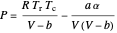 ,
,
where  is pressure (bar),
  is the ideal gas constant (
 ),
),  is temperature (K),
  is the critical temperature (K),
  is volume (
 ), and
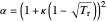
  ,
,  and
and  are constants:
 ,
,
 ,
,
 ,
,
where  is the critical pressure
 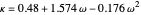 , and
, and  is the acentric factor.
The compressibility factor is defined by:
 .
.
Permanent Citation
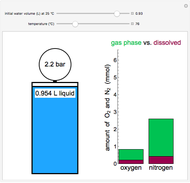 Heating Water and Air in a Sealed Container
Derek M. Machalek and Rachael L. Baumann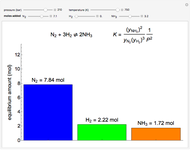 Chemical Equilibrium in the Haber Process
Benjamin L. Kee and Rachael L. Baumann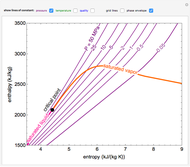 Enthalpy-Entropy Diagram for Water
Rachael L. Baumann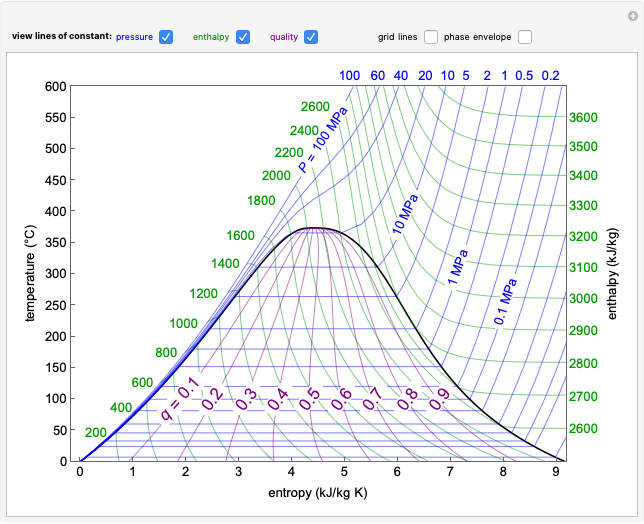 Temperature-Entropy Diagram for Water
Adam J. Johnston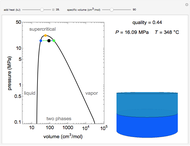 Pressure-Volume Diagram for Heating a Vapor-Liquid Mixture at a Constant Volume
Adam J. Johnston and Rachael L. Baumann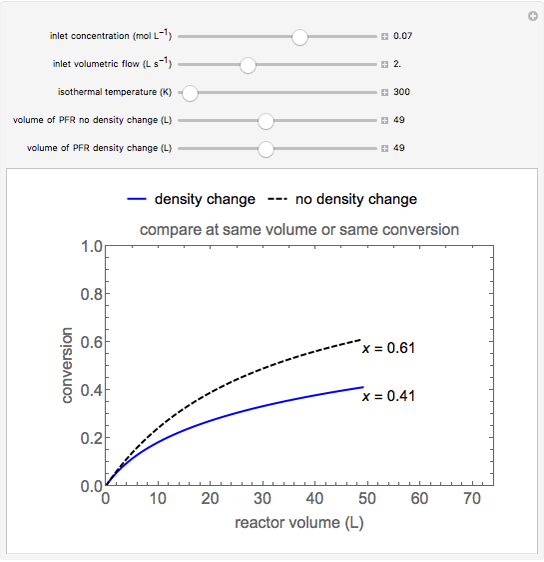 Why Density Change Cannot Be Ignored in a Plug Flow Reactor (PFR)
Rachael L. Baumann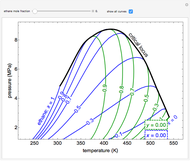 Pressure-Temperature Diagram for a Binary Mixture
Adam J. Johnston and Rachael L. Baumann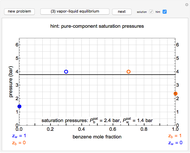 Construct a Pressure-Composition Diagram for Immiscible Liquids
Rachael L. Baumann Fugacity as a Driving Force for Mass Transfer
Rachael L. Baumann Single-Component Fugacity
Neil Hendren