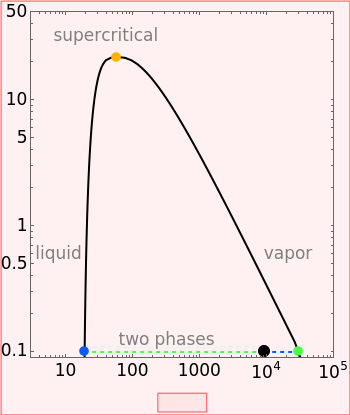
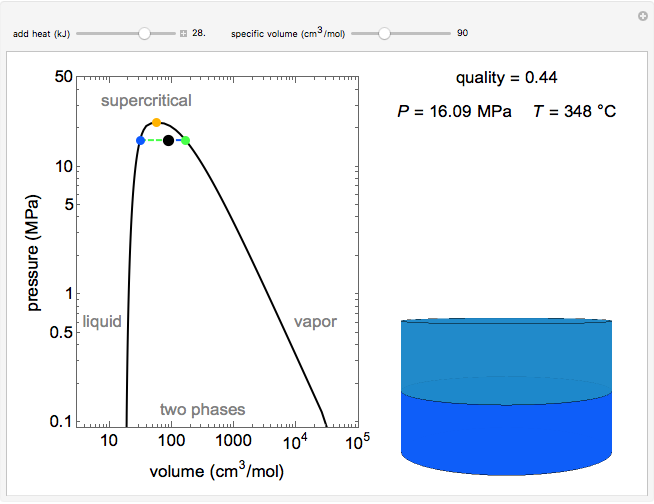
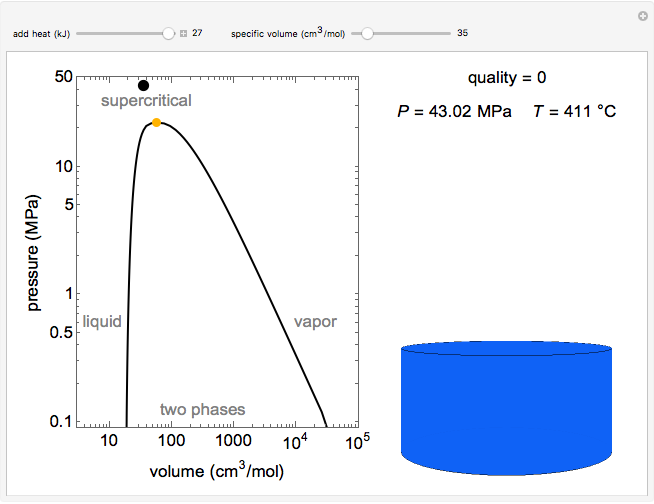
Pressure-Volume Diagram for Heating a Vapor-Liquid Mixture at a Constant Volume
Initializing live version


Requires a Wolfram Notebook System
Interact on desktop, mobile and cloud with the free Wolfram Player or other Wolfram Language products.
This Demonstration shows the phase behavior of 1 mol of water on a log pressure versus a log volume ( -
- ) phase diagram.
Contributed by: Adam J. Johnston and Rachael L. Baumann (September 2017)
Additional contributions by: John L. Falconer
(University of Colorado Boulder, Department of Chemical and Biological Engineering)
Open content licensed under CC BY-NC-SA
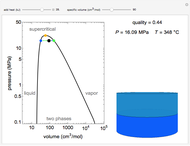
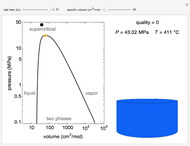
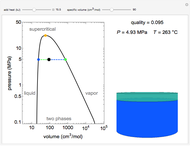
Snapshots

Details
Mass and energy balances are used to calculate the pressure and quality when two phases are present:
Related Demonstrations
More by Author
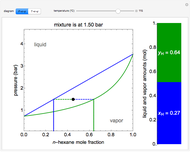
 Pressure-Temperature Diagram for a Binary Mixture
Adam J. Johnston and Rachael L. Baumann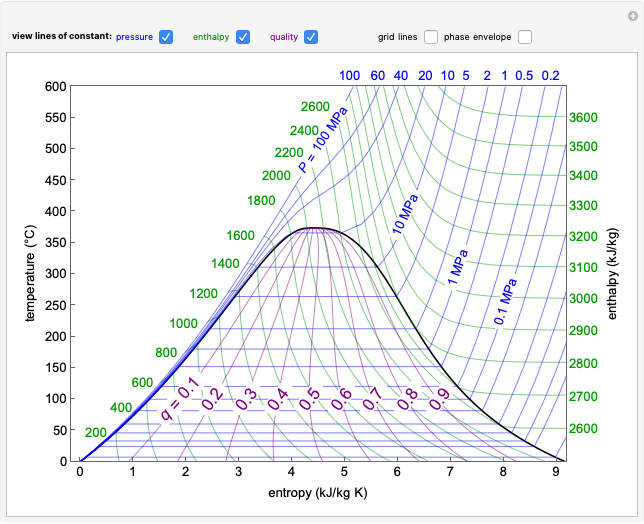 Temperature-Entropy Diagram for Water
Adam J. Johnston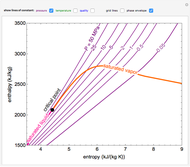 Enthalpy-Entropy Diagram for Water
Rachael L. Baumann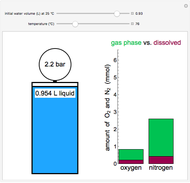 Heating Water and Air in a Sealed Container
Derek M. Machalek and Rachael L. Baumann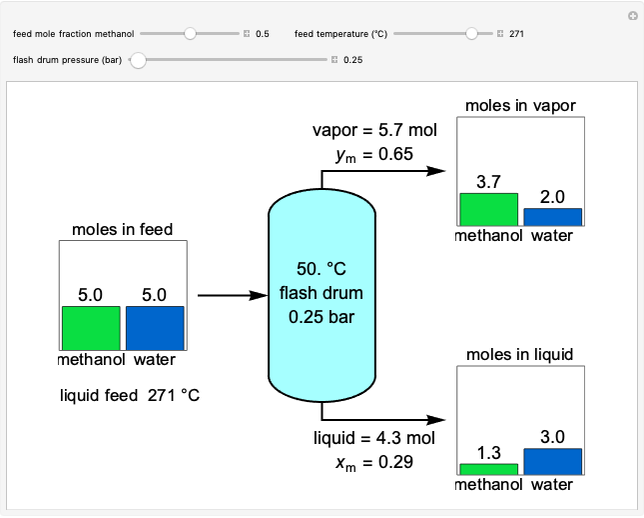 Adiabatic Flash Drum with Binary Liquid Feed
Derek Machalek and Rachael L. Baumann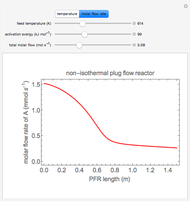 Parametric Sensitivity of Plug Flow Reactor With Heat Exchange
Rachael L. Baumann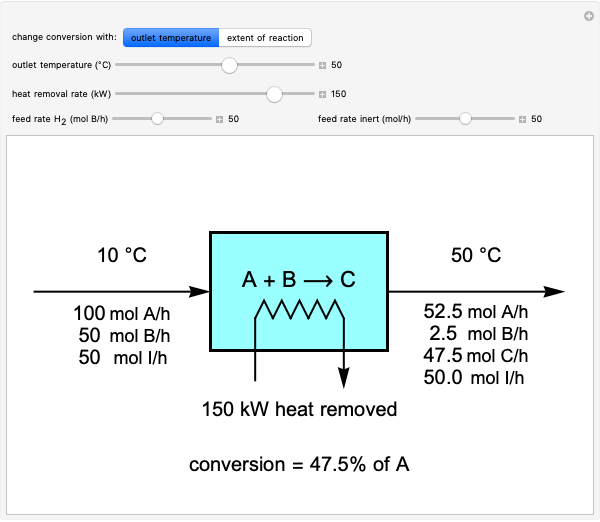 Material and Energy Balances in a Reactor with Heat Exchange
Michael Wrobel and Rachael L. Baumann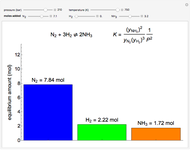 Chemical Equilibrium in the Haber Process
Benjamin L. Kee and Rachael L. Baumann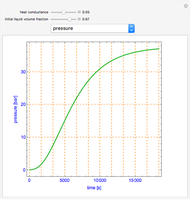 Heating Water in a Closed Vessel
Housam Binous, Ismail Boukholda, and Ahmed Bellagi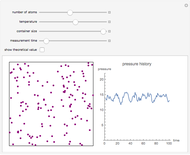 Simulation of a Simple Gas Pressure Model
Jon McLoone
-
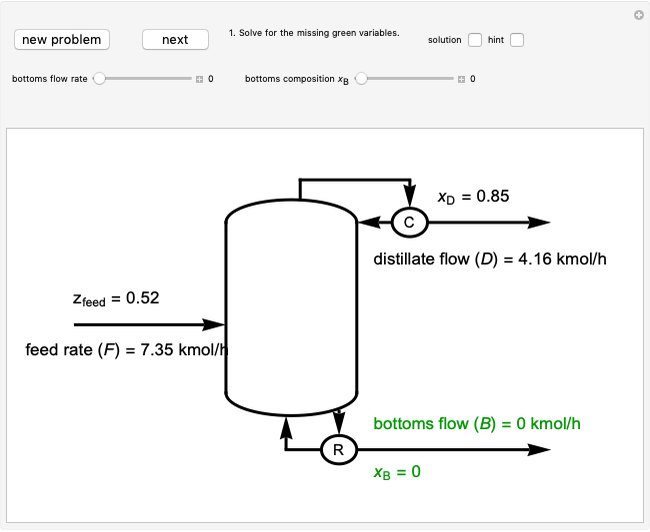
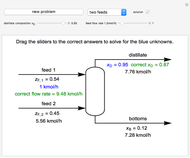 Solving Mass Balances on a Distillation Column
Rachael L. Baumann -
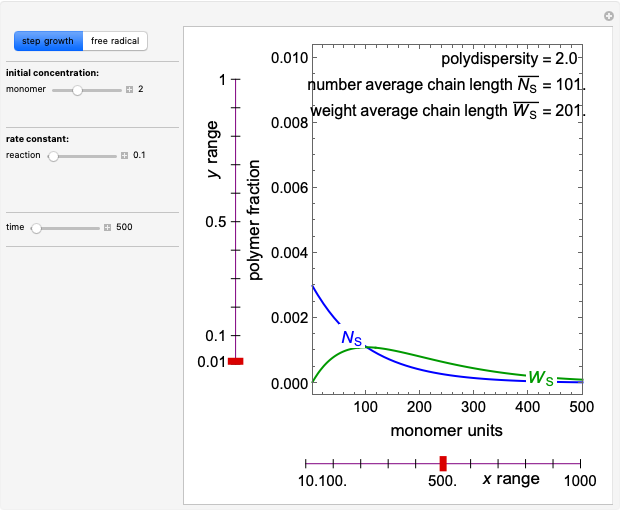 Polymerization in a Batch Reactor
Rachael L. Baumann -
 Construct a McCabe-Thiele Diagram for Distillation
Rachael L. Baumann -
 Construct an x-y Diagram for a Stripping Column
Rachael L. Baumann -
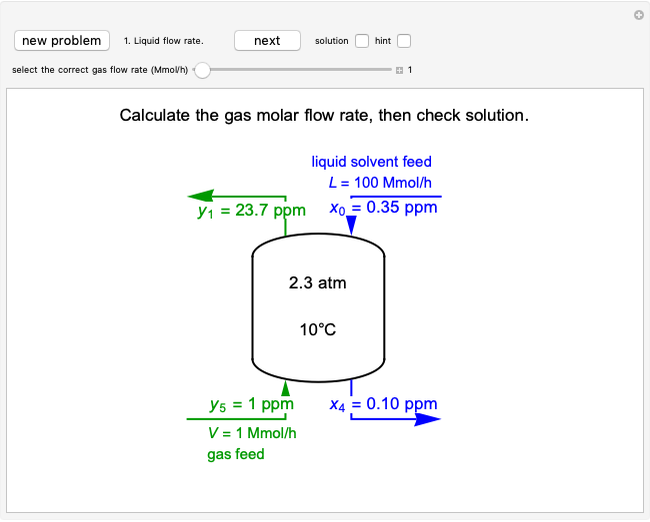
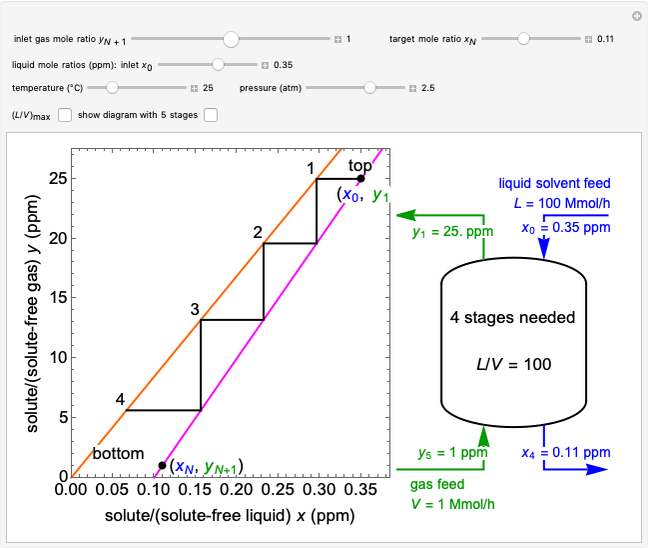
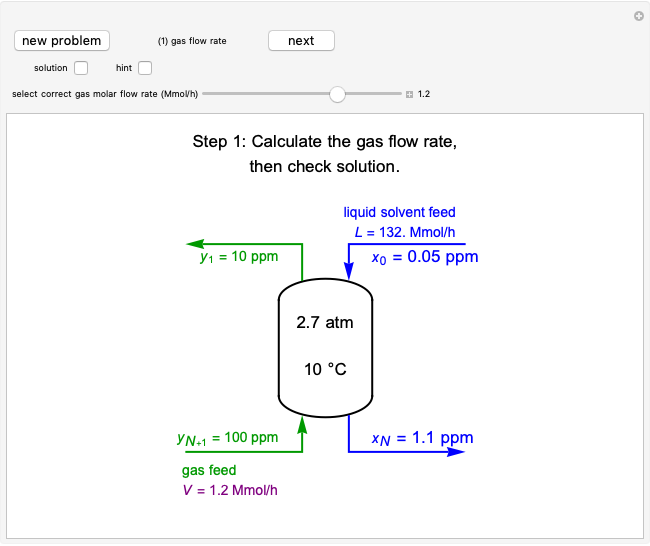 Construct an x-y Diagram for an Absorption Column
Rachael L. Baumann -
 Construct a Conversion-Temperature Diagram for a Reversible Adiabatic Reaction
Rachael L. Baumann -
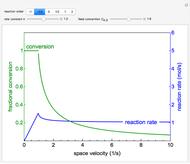 Reactor Rate and Conversion versus Space Velocity
Rachael L. Baumann -
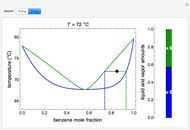
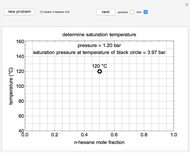 Construct a T-x-y Diagram for Vapor-Liquid Equilibrium (VLE)
Rachael L. Baumann -
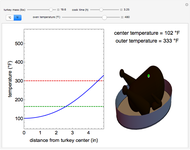 Cooking a Turkey
Rachael L. Baumann -
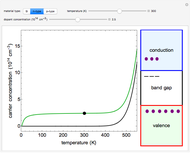 Electrical Conductivity of Silicon Semiconductors
Rachael L. Baumann -
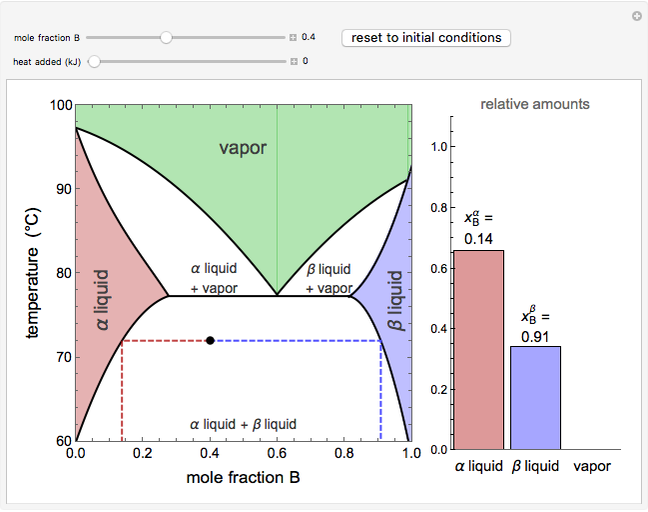 Vapor-Liquid-Liquid Equilibrium (VLLE)
Rachael L. Baumann -
 Vapor-Liquid Equilibrium Diagram for Non-Ideal Mixture
Rachael L. Baumann -
 Stripping Column Operation
Rachael L. Baumann -
 P-x-y and T-x-y Diagrams for Vapor-Liquid Equilibrium (VLE)
Rachael L. Baumann -
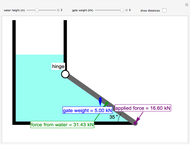 Forces on a Completely Submerged Gate
Rachael L. Baumann -
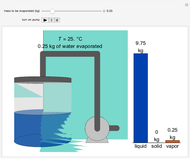 Evaporative Cooling of Water
Rachael L. Baumann -
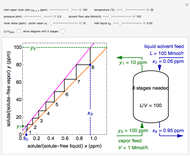 Operation of an Absorption Column
Rachael L. Baumann -
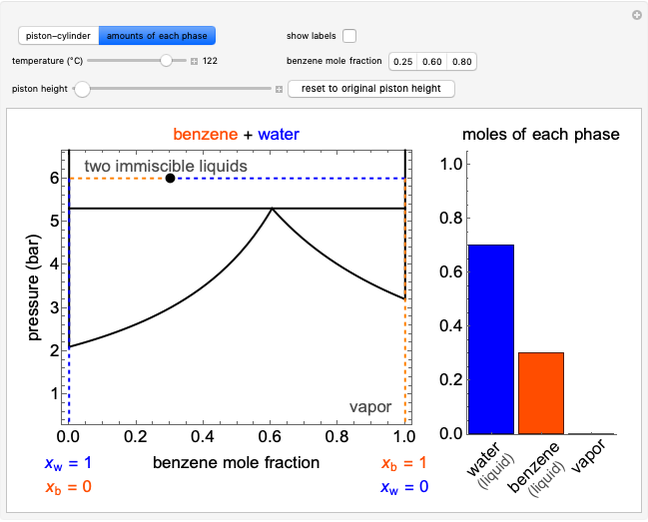 Immiscible Liquids on Pressure-Composition Diagram
Rachael L. Baumann -
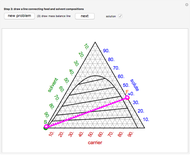
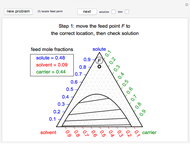 Apply the Hunter-Nash Method to Liquid-Liquid Extraction
Rachael L. Baumann -
 Construct Single-Stage, Liquid-Liquid Extraction
Rachael L. Baumann