Vapor-Liquid Equilibrium Diagram for Non-Ideal Mixture


Requires a Wolfram Notebook System
Interact on desktop, mobile and cloud with the free Wolfram Player or other Wolfram Language products.
This Demonstration shows  and
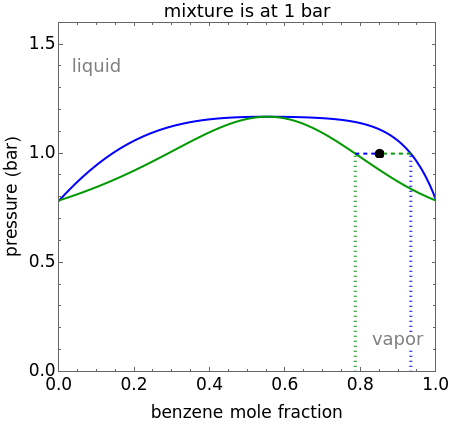
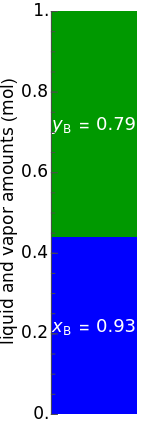
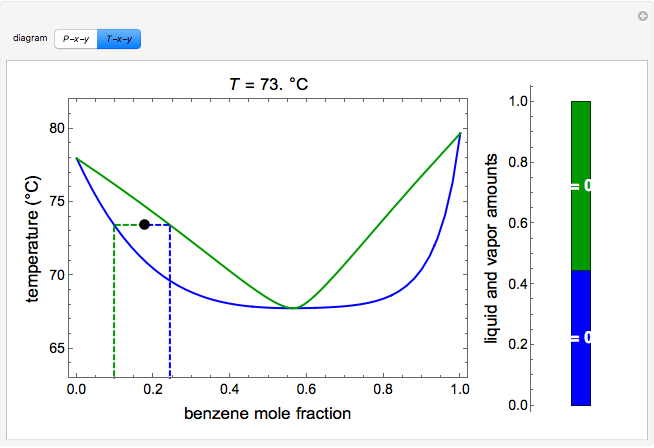
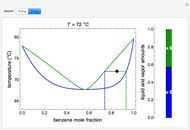
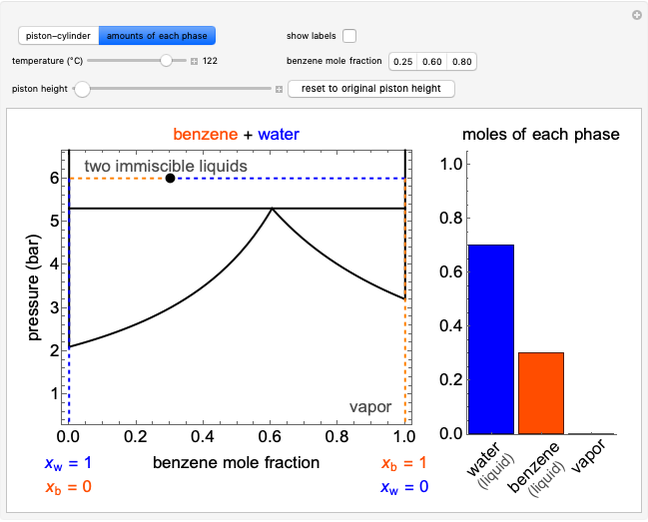
and  diagrams for vapor-liquid equilibrium (VLE) of a benzene/ethanol mixture. This liquid mixture is non-ideal, and the system has an azeotrope (a condition where liquid and vapor have the same composition). The blue curve represents the liquid-phase boundary (bubble point), and the green curve represents the vapor-phase boundary (dew point). You can vary the temperature for the diagram. Click and drag the black dot to change the benzene mole fraction and the temperature or pressure. The bar chart shows the moles of liquid (blue) and vapor (green) in equilibrium and the mole fraction of benzene in each phase (
 for liquid phase,
  for vapor phase). The system contains a total of 1 mol. The activity coefficients used in the modified Raoult's law are calculated using the two-parameter Margules model.
Contributed by: Rachael L. Baumann (June 2014)
Additional contributions by: John L. Falconer and Nick Bongiardina
(University of Colorado Boulder, Department of Chemical and Biological Engineering)
Open content licensed under CC BY-NC-SA
Snapshots


Details
The saturation pressure of component  is calculated using the Antoine equation:
 ,
,
where  ,
,  , and
, and  are Antoine constants,
  is temperature (°C), and
  is in bar.
The two-parameter Margules model is used to calculate the activity coefficients for a non-ideal liquid mixture of benzene  and ethanol
  . This model fits the excess Gibbs free energy:
 ,
,
where  is excess Gibbs energy, and
  is the ideal gas constant.
The activity coefficients  ,
,  are given by:
 ,
,
 ,
,
where  and
and  are the liquid mole fractions of benzene and ethanol and
  , and
, and  and
and  are the Margules parameters.
The modified Raoult's law is used to calculate the bubble-point and dew-point pressures using the  factors:
 ,
,
where  is the vapor mole fraction and
  , and
, and  is the total pressure (bar).
Bubble-point pressure calculation:
 .
.
Dew-point pressure calculation:
 .
.
The screencast video at [2] shows how to use this Demonstration.
References
[1] J. R. Elliott and C. T. Lira, Introductory Chemical Engineering Thermodynamics, New York: Prentice Hall, 2012 pp. 372–377, 430.
[2] Vapor-Liquid Equilibrium Diagram for Non-Ideal Mixture. www.colorado.edu/learncheme/thermodynamics/VLEDiagramNonIdealMixture.html.
Permanent Citation
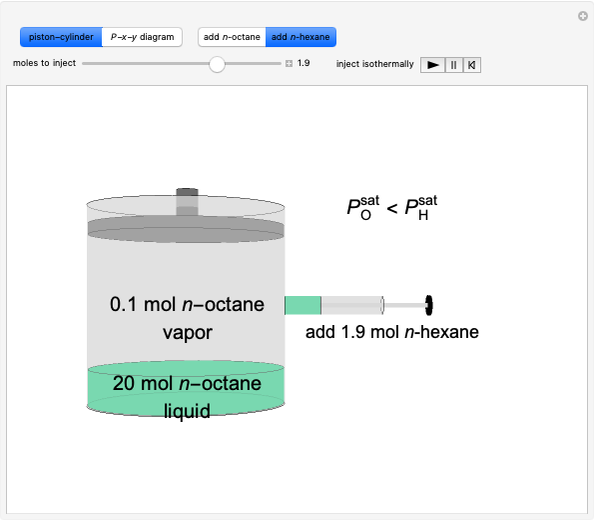 Adding a Second Component to a Single-Component Vapor-Liquid Equilibrium (VLE) Mixture
Rachael L. Baumann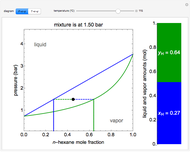 P-x-y and T-x-y Diagrams for Vapor-Liquid Equilibrium (VLE)
Rachael L. Baumann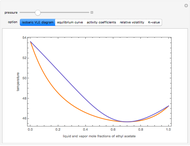 Isobaric Vapor Liquid Equilibrium Computations
Housam Binous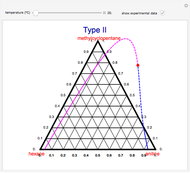 Effect of Temperature on Solubility of Aniline-Methylcyclopentane-Hexane System
Housam Binous, Farrukh Shehzad, Abdelmalek Hasseine, and Ahmed Bellagi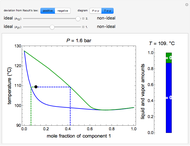 Non-Ideal Vapor-Liquid Equilibrium (VLE) Modeled by the Margules Equation
Rachael L. Baumann Construct a Pressure-Composition Diagram for Immiscible Liquids
Rachael L. Baumann Construction of Temperature-Composition Diagrams for Immiscible Liquids
Rachael L. Baumann Adding One Component to a Binary Vapor-Liquid Equilibrium (VLE) Mixture
Rachael L. Baumann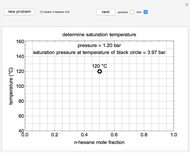 Construct a T-x-y Diagram for Vapor-Liquid Equilibrium (VLE)
Rachael L. Baumann Vapor-Liquid-Liquid Equilibrium (VLLE)
Megan Maguire and Neil C. Hendren
-
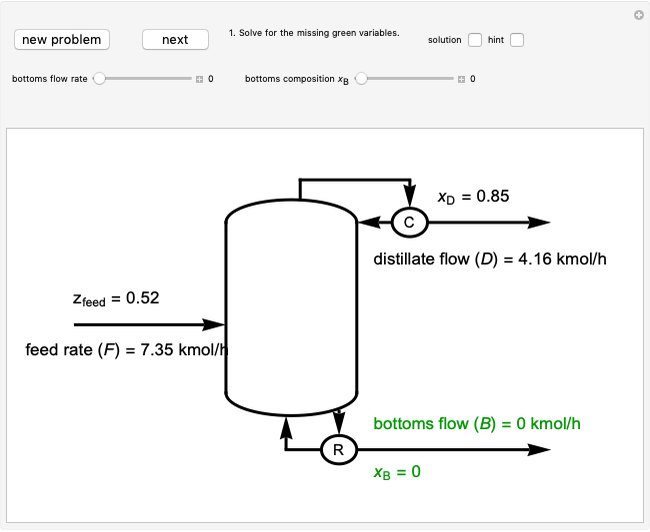
 Solving Mass Balances on a Distillation Column
Rachael L. Baumann -
 Polymerization in a Batch Reactor
Rachael L. Baumann -
 Construct a McCabe-Thiele Diagram for Distillation
Rachael L. Baumann -
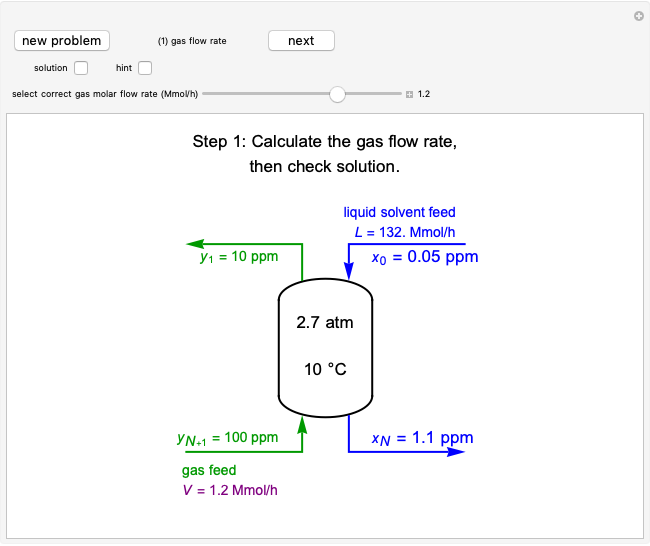
 Construct an x-y Diagram for a Stripping Column
Rachael L. Baumann -
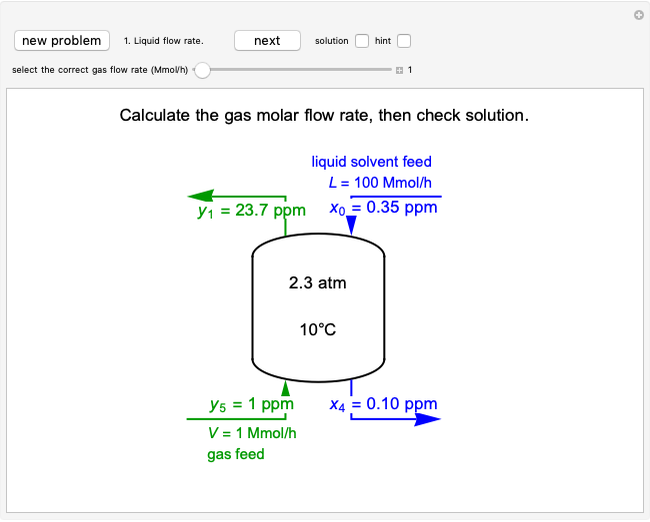
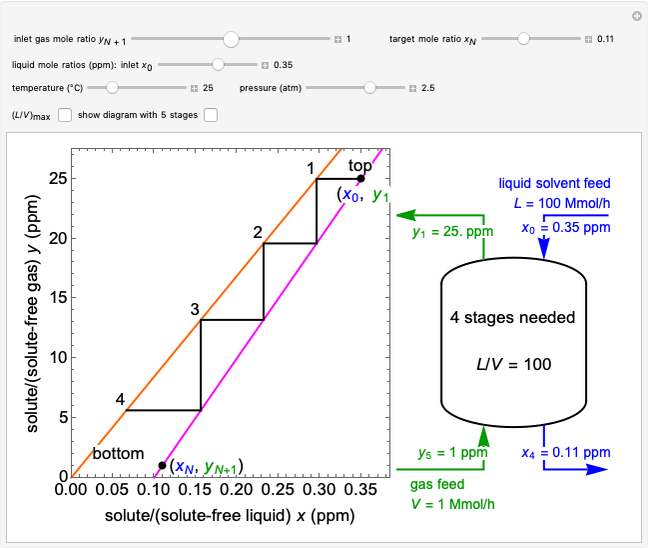
 Construct an x-y Diagram for an Absorption Column
Rachael L. Baumann -
 Construct a Conversion-Temperature Diagram for a Reversible Adiabatic Reaction
Rachael L. Baumann -
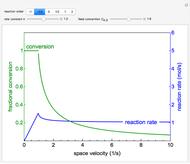 Reactor Rate and Conversion versus Space Velocity
Rachael L. Baumann -
Construct a T-x-y Diagram for Vapor-Liquid Equilibrium (VLE)
Rachael L. Baumann -
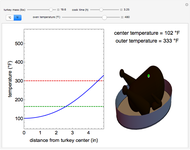 Cooking a Turkey
Rachael L. Baumann -
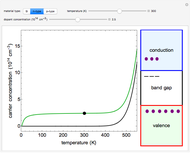 Electrical Conductivity of Silicon Semiconductors
Rachael L. Baumann -
Vapor-Liquid-Liquid Equilibrium (VLLE)
Rachael L. Baumann -
 Vapor-Liquid Equilibrium Diagram for Non-Ideal Mixture
Rachael L. Baumann -
 Stripping Column Operation
Rachael L. Baumann -
P-x-y and T-x-y Diagrams for Vapor-Liquid Equilibrium (VLE)
Rachael L. Baumann -
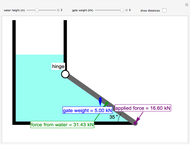 Forces on a Completely Submerged Gate
Rachael L. Baumann -
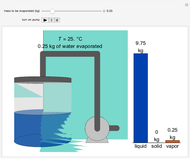 Evaporative Cooling of Water
Rachael L. Baumann -
 Operation of an Absorption Column
Rachael L. Baumann -
 Immiscible Liquids on Pressure-Composition Diagram
Rachael L. Baumann -
 Apply the Hunter-Nash Method to Liquid-Liquid Extraction
Rachael L. Baumann -
 Construct Single-Stage, Liquid-Liquid Extraction
Rachael L. Baumann