Hysteresis in the Flow Curves of Pseudoplastic Semiliquid Foods


Requires a Wolfram Notebook System
Interact on desktop, mobile and cloud with the free Wolfram Player or other Wolfram Language products.
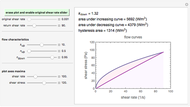
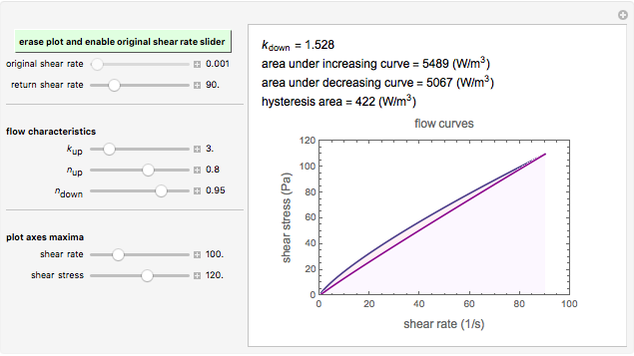
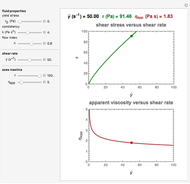
Shearing a pseudoplastic semiliquid food, such as fruit juice concentrate or nectar, in a viscometer frequently disrupts its microstructure. Consequently, the flow curve recorded by first raising and then lowering the shear rate exhibits a hysteresis loop. The loop's area represents the energy dissipated in the shearing process in terms of power per unit volume. This Demonstration shows the phenomenon in simulated flow curves accompanied by the calculated hysteresis area.
Contributed by: Mark D. Normand and Micha Peleg (July 2014)
Open content licensed under CC BY-NC-SA
Snapshots
Details
Snapshot 1: strongly pseudoplastic fluid, showing large hysteresis
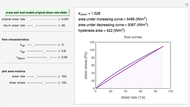
Snapshot 2: weakly pseudoplastic fluid, showing small hysteresis
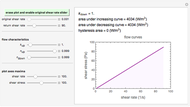
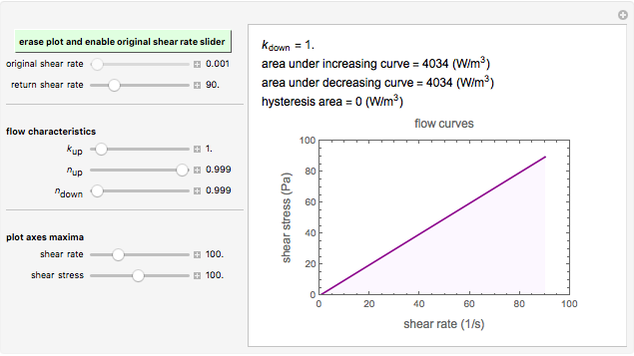
Snapshot 3: almost perfectly Newtonian fluid, showing no hysteresis
The flow curve of a pseudoplastic ("shear thinning," "power-law") fluid is described by the equation  , where
  is the shear stress,
  is the shear rate in
  ,
,  is the "consistency" in the corresponding units, and
  is the "flow index" (dimensionless). Thus, the curve for the increasing shear rate is
  , and for the decreasing rate it is
  , where
  and
and 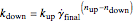 ;
;  is the shear rate turnover point. (Theoretically, the flow index can vary between zero and one. In practice, however, if an experimentally determined value is found to be much smaller than about 0.5, one should suspect slip in the rheometer's sensor.)
The area under a shear stress versus shear rate curve has the dimension of power per unit volume. For the increasing shear rate mode, it is 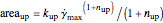 , and for the decreasing shear rate,
  . The hysteresis loop area is therefore
  .
.
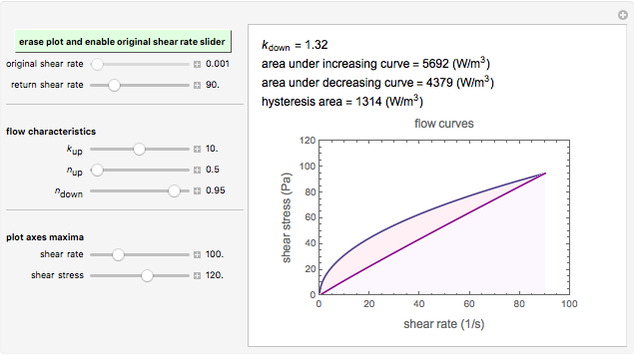
In this Demonstration, the pair of flow curves, up (increasing) and down (decreasing), is generated by dragging the original shear rate slider from its minimum value to its maximum and back to its minimum. To erase an existing plot and enable the grayed-out original shear rate slider, click the "erase plot and enable original shear rate slider" setter. After the existing flow curves are erased, move the original shear rate slider from its minimum to maximum to minimum values again. The upper limit of the original shear rate slider and the curves on the plot are set by the return shear rate slider. The "erase plot and enable original shear rate slider" setter only becomes active (colored light green) after the original shear rate slider has been moved through a complete minimum to maximum to minimum cycle, at which time the original shear rate slider becomes grayed out and inactive. The magnitudes of  ,
,  , and
, and  , as well as the plot's axes maxima, are chosen with sliders. The display includes a plot of the two flow curves (up and down), with the hysteresis loop area highlighted in a different color. The display also lists the numerical values of the calculated
  , the areas under each of the two flow curves and that of the hysteresis loop in
  after a complete minimum to maximum to minimum cycle of the original shear rate slider has been completed and the "erase plot and enable original shear rate slider" setter has become active.
Permanent Citation
 Flow Curves of a Herschel-Bulkley Fluid
Mark D. Normand and Micha Peleg Lubricated and Frictional Squeezing Flow
Mark D. Normand and Micha Peleg Estimating Processing Times in a Row of Storage Tanks
Mark D. Normand and Micha Peleg Gordon-Taylor and Fox Equations for Glass Transition Temperature
Mark D. Normand and Micha Peleg Structure of Dilute Suspensions
Mark D. Normand and Micha Peleg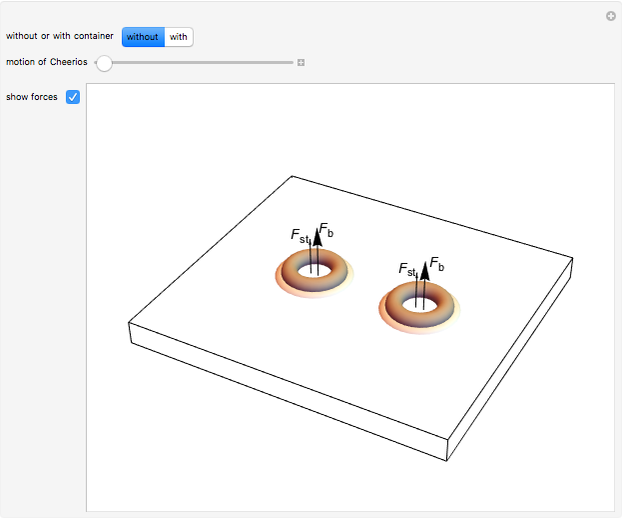 Clumping by Surface Tension
Dimei Wu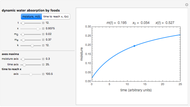 Dynamic Water Absorption by Foods
Mark D. Normand and Micha Peleg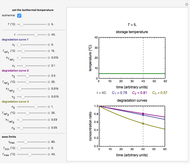 Thermal Degradation of Three Nutrients in Foods
Mark D. Normand and Micha Peleg Vitamin C Loss in Foods During Heat Processing and Storage
Mark D. Normand and Micha Peleg Endpoints Method for Predicting Chemical Degradation in Frozen Foods
Mark D. Normand and Micha Peleg
-
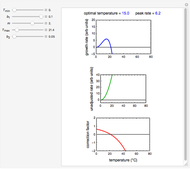 Ratkowski's Square Root Growth Rate Model for High Temperatures
Micha Peleg -
Gordon-Taylor and Fox Equations for Glass Transition Temperature
Micha Peleg -
 Force to Overcome Vacuum Pull
Micha Peleg -
 Extending the Square Root Growth Rate Model to Lethal Low Temperatures
Micha Peleg -
 Probability of Being Strange According to Paulos
Micha Peleg -
 Successive Three-Point Method for Weibullian Chemical Degradation
Micha Peleg -
 Estimating Cohesion and Tensile Strength of Compacted Powders
Micha Peleg -
 Three-Endpoints Method for Isothermal Weibullian Chemical Degradation
Micha Peleg -
Vitamin C Loss in Foods During Heat Processing and Storage
Micha Peleg -
 Parameterizing Temperature-Viscosity Relations
Micha Peleg -
 Laplace Distribution in Fluctuating Stock Index Records
Micha Peleg -
 Weibullian Chemical Degradation
Micha Peleg -
 Simulating Ascorbic Acid Degradation
Micha Peleg -
 Additive and Multiplicative Risks
Micha Peleg -
Endpoints Method for Predicting Chemical Degradation in Frozen Foods
Micha Peleg -
 Exponential Model for Arrhenius Activation Energy
Micha Peleg -
 Prediction of Isothermal Degradation by the Endpoints Method
Micha Peleg -
 Risk Guesstimation from Factor Ranges
Micha Peleg -
 Volatiles Formation Kinetics in Stored Fish
Micha Peleg -
 Comparison of Six Sigmoid Growth Curve Models
Micha Peleg