Injury in Microbial Inactivation

Requires a Wolfram Notebook System
Interact on desktop, mobile and cloud with the free Wolfram Player or other Wolfram Language products.
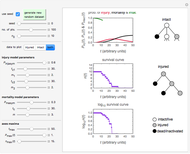
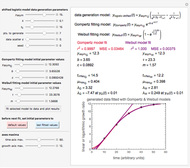
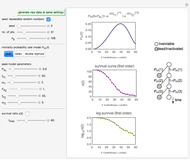
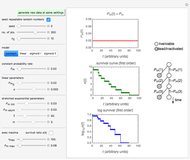
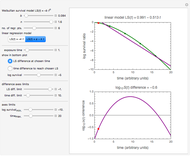
Survival curves of microorganisms and spores exposed to a lethal agent (such as heat, cold, chemical preservative, disinfectant, ultra-high radiation, or hydrostatic pressure) are usually determined by counting the colonies formed by the survivors under optimal growth conditions. If, in parallel, the recovery is also done under stressful conditions, where only intact cells can divide and intact spores germinate, the difference between the two counts gives a measure of the number of injured cells or damaged spores. This Demonstration lets you see the principle by generating survival curves of the two kinds and plotting the difference on linear and semi-logarithmic coordinates. The curves of the total and intact survivors are generated with the Weibull distribution as a model and they can be concave down (accumulated damage), concave up ("tailing"), or log-linear ("first order kinetics").
Contributed by: Mark D. Normand and Micha Peleg (May 2013)
Open content licensed under CC BY-NC-SA
Snapshots
Details
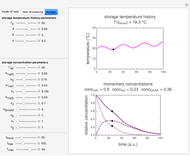
Snapshot 1: low injury where  and
and 
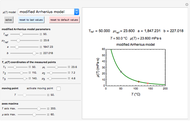
Snapshot 2: dominant injury where  and
and 
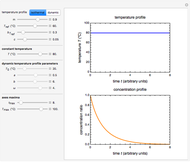
Snapshot 3: low injury and mortality where  and
and 
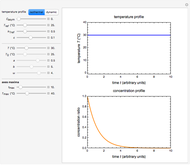
Snapshot 4: log-linear injury,  and
and 
Most microbial survival curves can be determined by counting the colonies formed by survivors under optimal growth or germination conditions. The result, therefore, does not account for the uncounted injured cells or spores that could repair the damage if given more time, and for those injured and counted as viable that would not grow under less-than-optimal conditions. A way to avoid this problem is to recover the survivors under optimal conditions, yielding the total count, and separately under stressful conditions under which only the intact cells or spores will produce colonies. The difference between the counts is considered the number of injured cells or spores.
In this Demonstration, you can generate Weibullian curves of the total and of the intact survivors and calculate the curve of the injured ones by subtraction. The generated survival model of the total survival is  , and that of the intact is
  , where the
  are the momentary survival ratios
  , where
  and
and  are the momentary and initial numbers, the
  are the scale factors in arbitrary time units, and the
  are the dimensionless shape factors. The survival curve of the injured is therefore
  .
.
You can use the sliders to enter the values of  ,
,  ,
,  , and
, and  , as well as the plot axes' limits.
To avoid the generation of unrealistic survival curves, the choice of the Weibullian parameters is limited by the conditions  and
and  .
.
Notice that  implies that the survival curve has downward concavity, and
  implies upper concavity. The traditional first-order kinetic model is just a special case of the Weibullian model, with
  .
.
The Demonstration plots the curves of the total and intact as solid orange and blue lines and of the injured cells or spores as a dashed red line on linear and semi-logarithmic coordinates.
Note that not all allowed parameter combinations have real-life counterparts.
Reference
[1] M. G. Corradini and M. Peleg, "A Weibullian Model of Microbial Injury and Mortality," International Journal of Food Microbiology, 119(3), 2007 pp. 319–328. doi:10.1016/j.ijfoodmicro.2007.08.035.
Permanent Citation


