Weibullian versus Log-Linear Microbial Survival Models

Requires a Wolfram Notebook System
Interact on desktop, mobile and cloud with the free Wolfram Player or other Wolfram Language products.
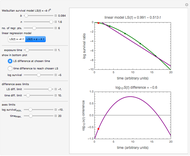
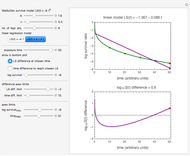
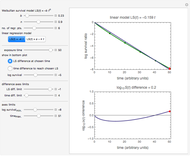
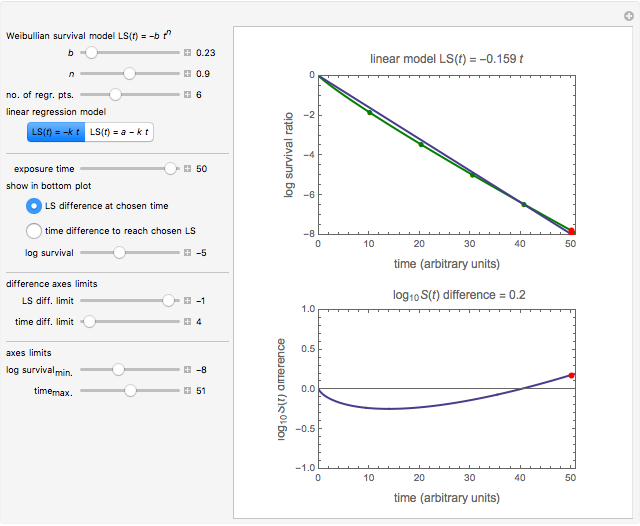
The official method for sterility calculations in foods is still based on the assumption that microbial thermal inactivation follows first-order kinetics, despite growing evidence that it does not. In this Demonstration, experimental isothermal survival data is simulated using the Weibullian model and fitted with the log-linear model. The discrepancy between the two is expressed in terms of the reached survival ratio after a chosen time at a lethal temperature or time needed to reach a chosen survival ratio at this temperature. It shows that, depending on the semi-logarithmic survival curve curvature and its concavity direction, the differences between the two models can be substantial.
Contributed by: Mark D. Normand and Micha Peleg (May 2014)
Open content licensed under CC BY-NC-SA
Snapshots

Details
Snapshot 1: differences in the calculated accomplished survival ratio between the standard method and the Weibullian where  (downward concavity)
Snapshot 2: differences in the calculated accomplished survival ratio between the standard method and the Weibullian where  (upward concavity/tailing)
Snapshot 3: differences in the calculated accomplished survival ratio between the standard method and the Weibullian where  (almost linear and the log-linear model starting at zero)
Dictated by governmental regulating agencies, sterility and microbial safety calculations in the food industry are based on the assumption that thermal inactivation of microbial cells and bacterial spores follows first-order kinetics. This implies that the isothermal survival curves when plotted on semi-logarithmic coordinates all ought to be straight lines, that is,  , where
  is the survival ratio
  (the number of surviving cells or spores after time
  divided by their initial number
  ) and
) and  is the temperature-dependent experimental inactivation rate in the particular food or medium. There is growing evidence, however, that more often than not, microbial survival curves are not log-linear but follow other models. Among these, the most common is the Weibullian model [1, 2], which can be written in the form
  , where
  is a "rate parameter" associated with the Weibull distribution's scale factor and
  is a measure of the curve's concavity ("shape factor"), as originally proposed by Rosin and Rammler for particulates disintegration. Where
  , the curve has downward concavity and where
  , upward concavity. The log-linear model is a special case of the Weibullian model where
  . In common practice, experimental isothermal data obtained in the actual food or a surrogate medium is fitted with the log-linear model and the reciprocal of , known as the "D-value", is used in the calculation of thermal process efficacy [3].
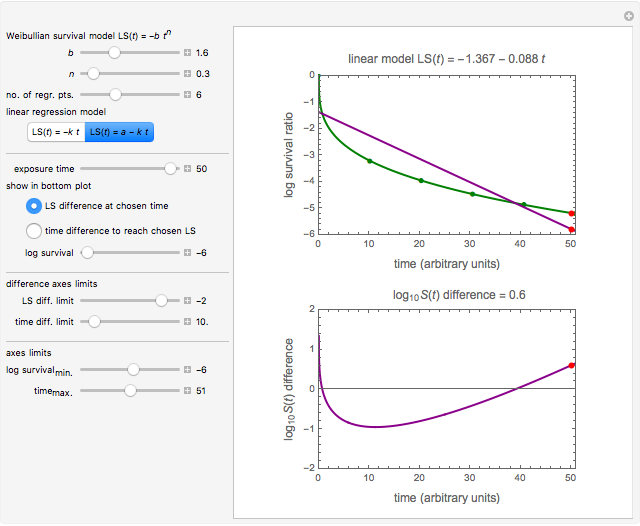
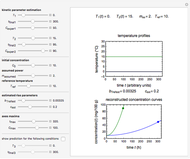
A frequently asked question is how the data's curvature affects the "D-value" and hence the theoretical sterility reached in thermal preservation. In this Demonstration, this issue is addressed by generating survival data with the Weibullian model, fitting it with the log-linear model, and calculating the discrepancy in terms of the times needed to achieve a chosen survival ratio, actual decades reduction, or the number of decades reduction at a chosen time.
You can vary the Weibullian model's parameters, the number of generated data points, the chosen inactivation level, and isothermal time. You can choose whether to fit the data with the equation  (or
(or  ) or
) or  (or
(or  ). You can also choose the survival ratio or processing time. The display includes the values of
  and
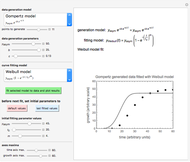
and  for the particular parameter's setting and a plot of the generated data on which the Weibullian (in green) and fitted log-linear curves (in dark blue or dark magenta) are superimposed.
As shown, the discrepancy between the Weibullian and log-linear curves increases with the survival data's curvature. The Demonstration also shows that while applying the log-linear model to data with downward concavity results in over-processing, its application to survival data having upward concavity can be a risky proposition unless a large safety factor is implemented.
References
[1] M. Peleg, Advanced Quantitative Microbiology for Food and Biosystems: Models for Predicting Growth and Inactivation, Boca Raton, FL: CRC Press, 2006.
[2] M. A. J. S. van Boekel, "On the Use of the Weibull Model to Describe Thermal Inactivation of Microbial Vegetative Cells," International Journal of Food Microbiology, 74, 2002 pp. 139–159.
[3] R. Simpson (ed.), Engineering Aspects of Thermal Food Processing, Boca Raton, FL: CRC Press, 2009.
Permanent Citation
 Extracting Microbial Inactivation Parameters from Final Survival Ratios
Mark D. Normand and Micha Peleg Probabilistic Model Showing Sigmoid Semilogarithmic Survival
Mark D. Normand, Micha Peleg, and Zack J. Rosenthal Growth Inhibition and Retardation by Antimicrobials
Mark D. Normand and Micha Peleg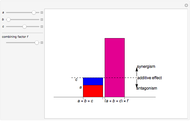 Food Preservation Hurdle Technology
Mark D. Normand and Micha Peleg Extracting Microbial Inactivation Parameters from Final Isothermal Survival Ratios
Mark D. Normand and Micha Peleg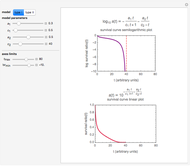 Sigmoid Microbial Survival Curves
Mark D. Normand and Micha Peleg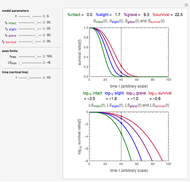 Degrees of Microbial Injury and Survival
Mark D. Normand and Micha Peleg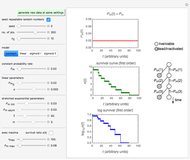 Probabilistic Model for Microbial Mortality
Mark D. Normand and Micha Peleg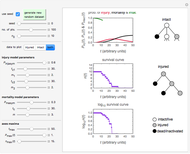 Stochastic Model of Microbial Injury and Mortality
Mark D. Normand , Maria G. Corradini, and Micha Peleg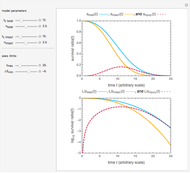 Injury in Microbial Inactivation
Mark D. Normand and Micha Peleg
-
 Ratkowski's Square Root Growth Rate Model for High Temperatures
Micha Peleg -
 Gordon-Taylor and Fox Equations for Glass Transition Temperature
Micha Peleg -
 Force to Overcome Vacuum Pull
Micha Peleg -
 Extending the Square Root Growth Rate Model to Lethal Low Temperatures
Micha Peleg -
 Probability of Being Strange According to Paulos
Micha Peleg -
 Successive Three-Point Method for Weibullian Chemical Degradation
Micha Peleg -
 Estimating Cohesion and Tensile Strength of Compacted Powders
Micha Peleg -
 Three-Endpoints Method for Isothermal Weibullian Chemical Degradation
Micha Peleg -
 Vitamin C Loss in Foods During Heat Processing and Storage
Micha Peleg -
 Parameterizing Temperature-Viscosity Relations
Micha Peleg -
 Laplace Distribution in Fluctuating Stock Index Records
Micha Peleg -
 Weibullian Chemical Degradation
Micha Peleg -
 Simulating Ascorbic Acid Degradation
Micha Peleg -
 Additive and Multiplicative Risks
Micha Peleg -
 Endpoints Method for Predicting Chemical Degradation in Frozen Foods
Micha Peleg -
 Exponential Model for Arrhenius Activation Energy
Micha Peleg -
 Prediction of Isothermal Degradation by the Endpoints Method
Micha Peleg -
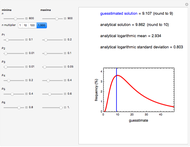 Risk Guesstimation from Factor Ranges
Micha Peleg -
 Volatiles Formation Kinetics in Stored Fish
Micha Peleg -
 Comparison of Six Sigmoid Growth Curve Models
Micha Peleg