Sigmoid Microbial Survival Curves

Requires a Wolfram Notebook System
Interact on desktop, mobile and cloud with the free Wolfram Player or other Wolfram Language products.
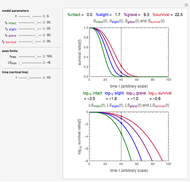
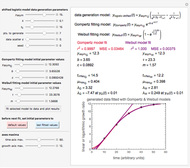
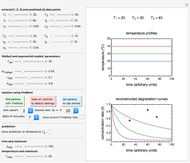
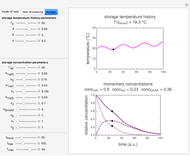
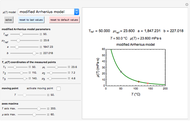
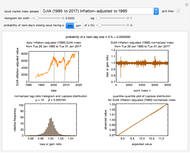
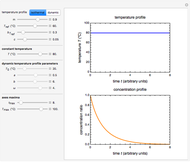
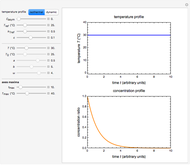
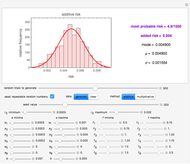
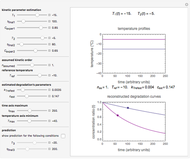
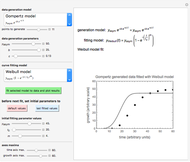
This Demonstration simulates and plots static sigmoid survival curves for microbial cells or spores subjected to heat treatment or exposed to a lethal agent such as a chemical preservative or disinfectant, ultra-high hydrostatic pressure, radiation, etc. The generated survival curve is plotted in semilogarithmic (top) and linear (bottom) coordinates. The curve can be of type I, where the initial upper concavity, when plotted on semilogarithmic coordinates, progressively changes to downward concavity, or type II, where the initial downward concavity progressively changes to upper concavity (tailing).
Contributed by: Mark D. Normand and Micha Peleg (January 2013)
Open content licensed under CC BY-NC-SA
Snapshots
Details
Snapshot 1: sigmoid survival curve of type I with an inconspicuous shoulder and low resistance
Snapshot 2: sigmoid survival curve of type I with a prominent shoulder and high resistance
Snapshot 3: sigmoid survival curve of type II with an inconspicuous shoulder and high residual survival
Snapshot 4: sigmoid survival curve of type II with a prominent shoulder and low residual survival
This Demonstration simulates and plots static sigmoid survival curves of microbial cells or spores of the kind occasionally recorded in thermal sterilization or pasteurization and also in nonthermal preservation treatments such as with a chemical preservative, natural antimicrobial, application of ultra-high hydrostatic pressure, exposure to radiation, etc.
The generated survival curve for the chosen model and entered parameters is plotted on semilogarithmic (top display) and linear (bottom display) coordinates with the respective model's equation. The upper limit of the time axis, and in the case of the semilogarithmic plot, the lower limit of the  axis, can be varied using the sliders.
The model generating type II curves allows for the existence of an asymptotic survival ratio ("extreme tailing") which is marked by a horizontal dashed line.
References
[1] M. Peleg, "Calculation of the Non-Isothermal Inactivation Patterns of Microbes Having Sigmoidal Isothermal Semi-logarithmic Survival Curves," Critical Reviews in Food Science and Nutrition, 43(6), 2003 pp. 645–658. doi:10.1080/10408690390251156.
[2] M. Peleg, Advanced Quantitative Microbiology for Food and Biosystems: Models for Predicting Growth and Inactivation, Boca Raton, FL: CRC Press, 2006.
Permanent Citation
"Sigmoid Microbial Survival Curves"
http://demonstrations.wolfram.com/SigmoidMicrobialSurvivalCurves/
Wolfram Demonstrations Project
Published: January 2 2013


