Polar Fourier Transform
Initializing live version


Requires a Wolfram Notebook System
Interact on desktop, mobile and cloud with the free Wolfram Player or other Wolfram Language products.
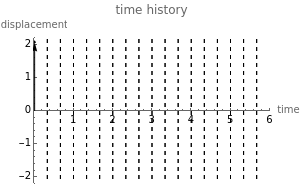
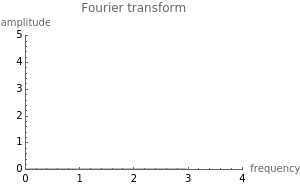
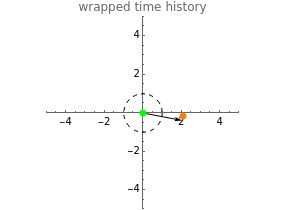
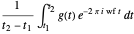
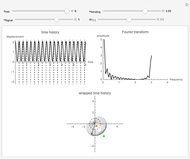
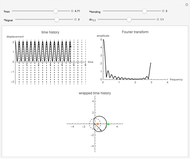
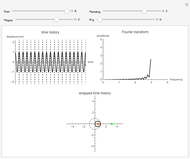
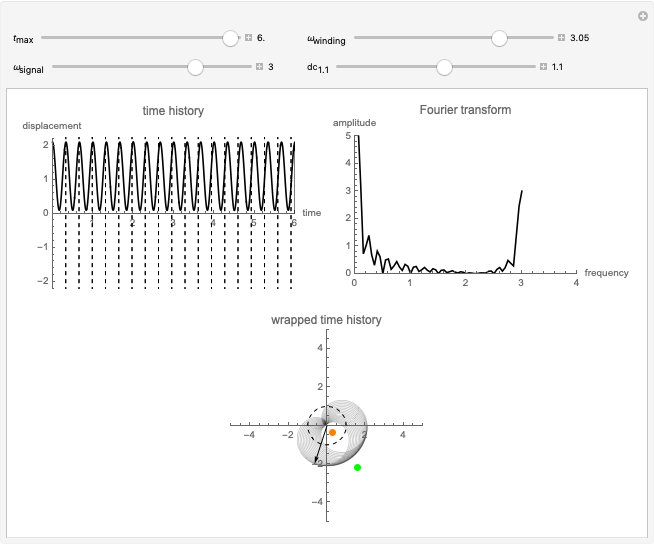
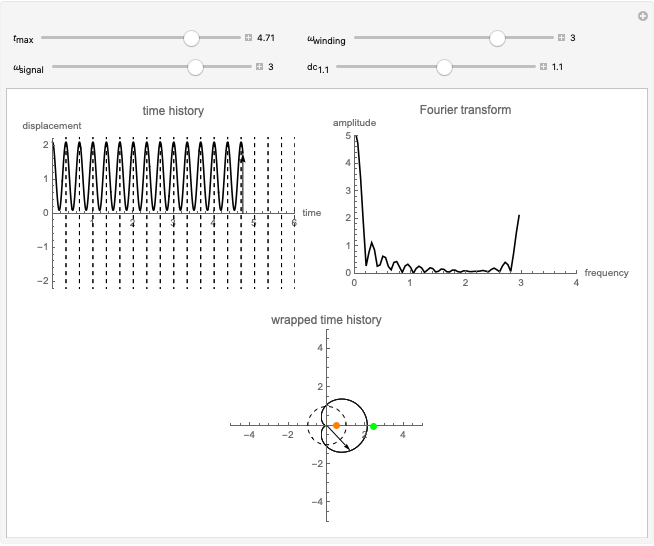
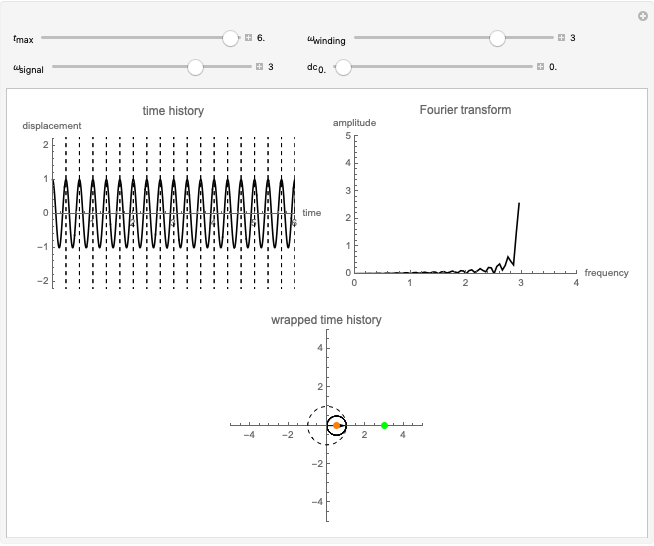
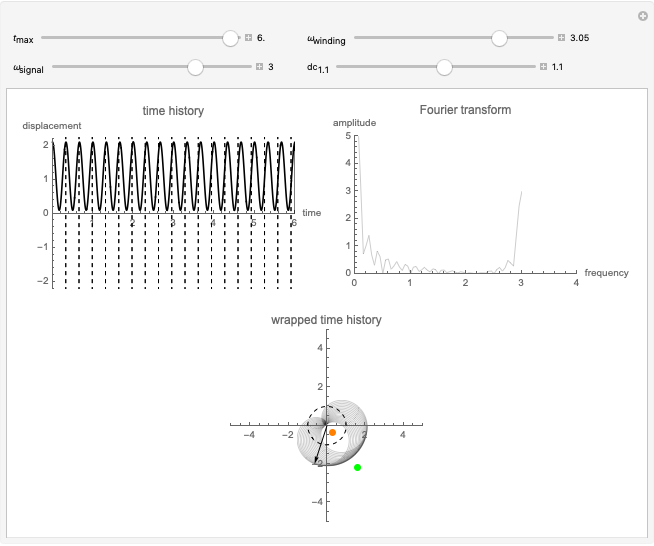
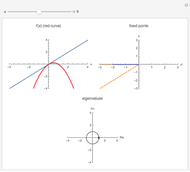
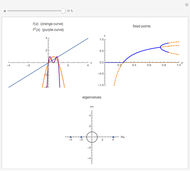
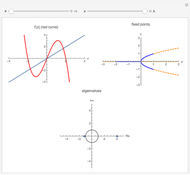
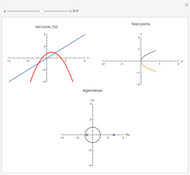
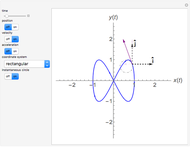
The Fourier transform quantifies the frequency content of a signal. We do this by first converting the time history to polar coordinates. Next, the speed at which the signal is wrapped in polar coordinates is varied with the winding frequency,  . The orange dot is at the center of mass of the wrapped time history:

Contributed by: Edmon Perkins (July 2020)
After work by: 3Blue1Brown, Grant Sanderson
Open content licensed under CC BY-NC-SA
Snapshots
Details
Permanent Citation
Related Demonstrations
More by Author
 Discrete Fourier Sine and Cosine Transforms
Daniel de Souza Carvalho XFT: An Improved Fast Fourier Transform
Rafael G. Campos, J. Jesus Rico Melgoza, and Edgar Chavez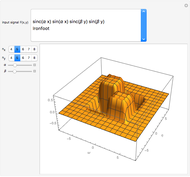 XFT2D: A 2D Fast Fourier Transform
Rafael G. Campos, J. Jesus Rico Melgoza, and Edgar Chavez From Continuous- to Discrete-Time Fourier Transform by Sampling Method
Nasser M. Abbasi Fractional Fourier Transform
Enrique Zeleny One-Sided Fourier Transform: Application to Linear Absorption and Emission Spectra
Liam Cleary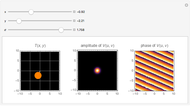 Amplitude and Phase in 2D Fourier Transforms
Katherine Rosenfeld Amplitude Modulation
Jakub Serych Synthesis with Even and Odd Functions
Aaron T. Becker Fourier Transform of Radially Symmetric Potential Functions
Pep Pàmies
-
 Polar Fourier Transform
Edmon Perkins -
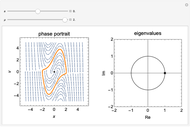
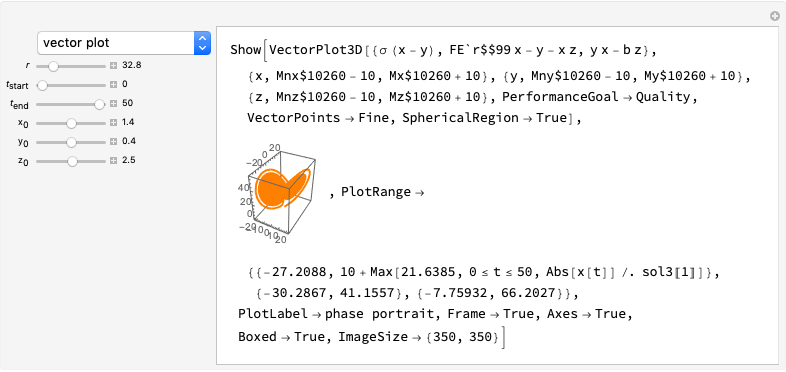 Stability of the Lorenz System
Edmon Perkins -
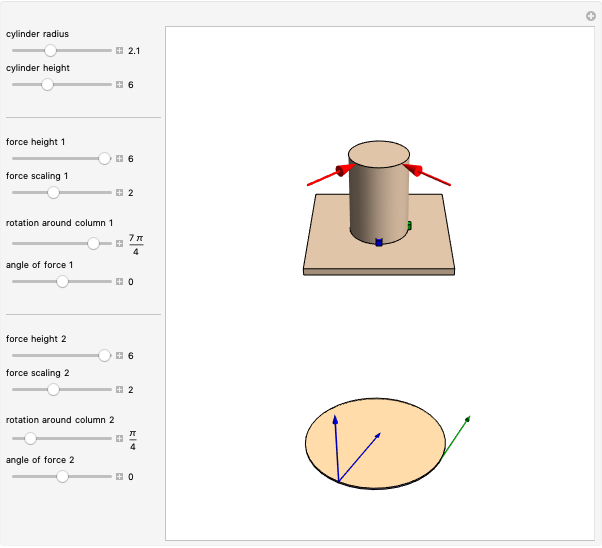
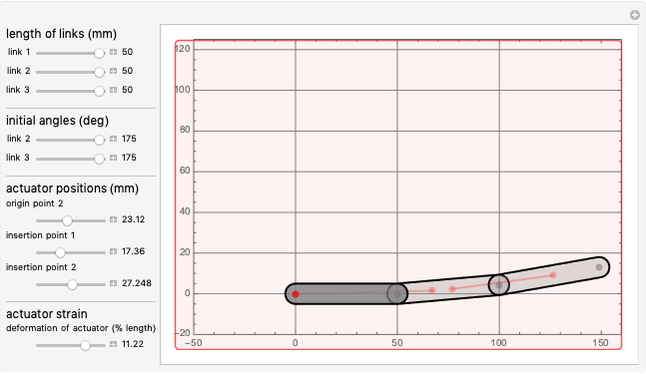 Effects of Deformation on Actuated Joints
Edmon Perkins -
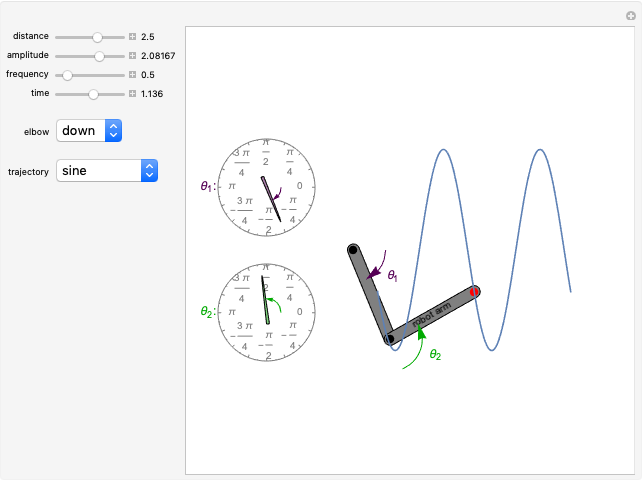 End Effector Trajectory Tracking for Planar Linkage
Edmon Perkins -
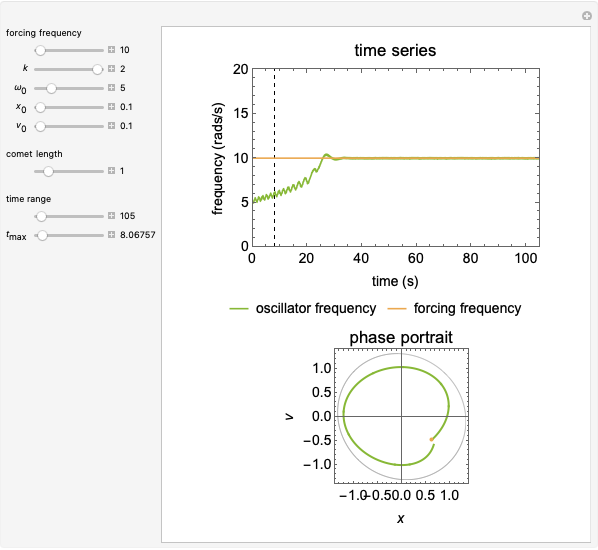 Adaptive Frequency Hopf Oscillator
Edmon Perkins -
 Combined Loading and Reaction Stresses
Edmon Perkins -
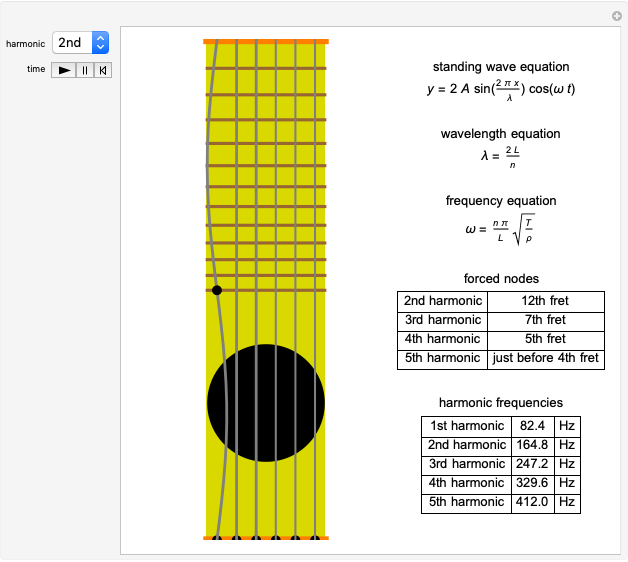 Guitar String Harmonics: Standing Waves
Edmon Perkins -
 Hopf Bifurcation in a Biased van der Pol Oscillator
Edmon Perkins -
 Transcritical Bifurcation of a Nonlinear Function
Edmon Perkins -
 Flip Bifurcation in Dynamical Systems
Edmon Perkins -
 Pitchfork Bifurcation in Dynamical Systems
Edmon Perkins -
 Saddle-Node Bifurcation
Edmon Perkins -
 2D Kinematics on a Figure-Eight Curve
Edmon Perkins