Choosing a Data Transformation with the Box-Whisker Plot


Requires a Wolfram Notebook System
Interact on desktop, mobile and cloud with the free Wolfram Player or other Wolfram Language products.
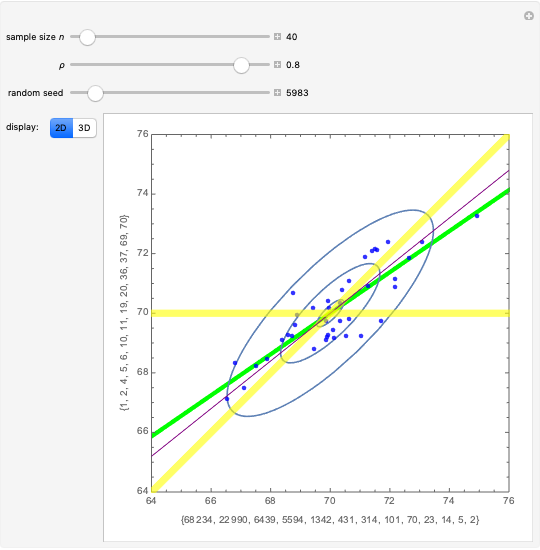
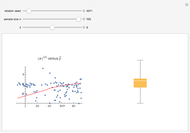
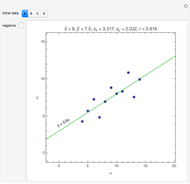
This Demonstration shows the effect of a power data transformation,
[more]


Contributed by: Ian McLeod (March 2011)
Open content licensed under CC BY-NC-SA
Snapshots


Details
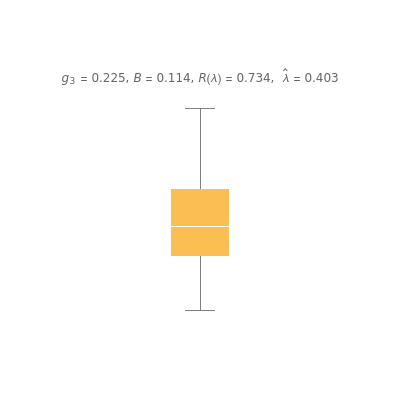
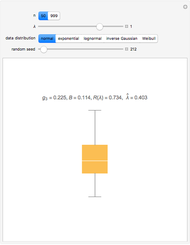
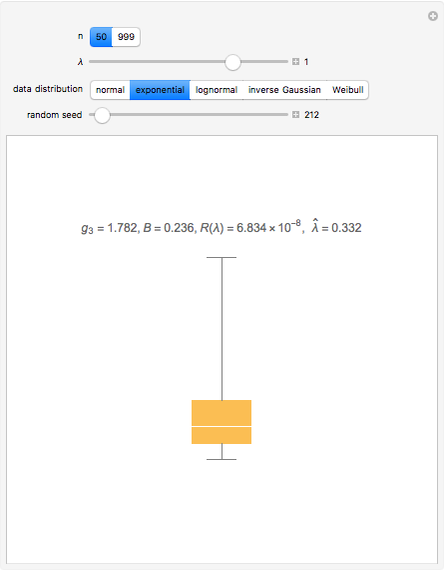
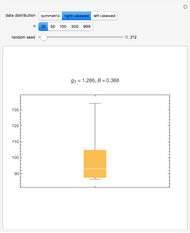
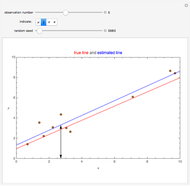
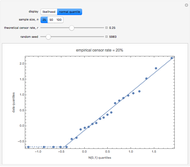
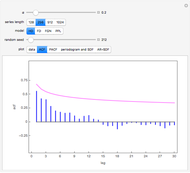
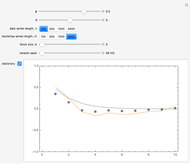
Data transformations such as square-root and logs are often used in statistics to improve the model assumptions. See [1] for examples, with actual data, of the use of box-and-whisker plots to choose a transformation.
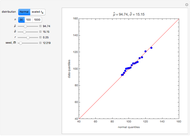
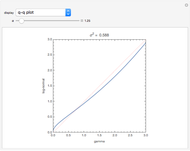
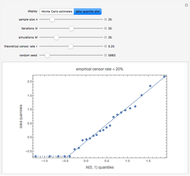
Using Mathematica's built-in functions Manipulate and BoxWhisker with the family of power transformations provides a simple and effective method for choosing a suitable transformation with real data. For comparison and for pedagogical purposes, we have included skewness and maximum likelihood methods for choosing  .
.
[2] discusses the use of maximum likelihood estimation for in the family of power transformations,
 .
.
[3] discusses choosing a power transformation by minimizing absolute skewness. The robust skewness statistic computed using QuartileSkewness is sometimes called Bowley skewness (Wolfram MathWorld).
The use of the relative likelihood function for statistical inference is discussed in the books [4] and [5].
References:
[1] W. S. Cleveland, Visualizing Data, Summit, NJ: Hobart Press, 1993.
[2] G. E. P. Box and D. R. Cox, "An Analysis of Transformations," Journal of the Royal Statistical Society B, 26(2), 1964 pp. 211–252.
[3] D. V. Hinkley, "On Power Transformations to Symmetry,” Biometrika, 62, 1975 pp. 101–111.
[4] A. Azzalini, Statistical Inference, Boca Raton, FL: Chapman & Hall/CRC, 1996.
[5] D. A. Sprott, Statistical Inference in Science, New York: Springer, 2000.
Permanent Citation
 Exploring Skewness in Box Plots
Ian McLeod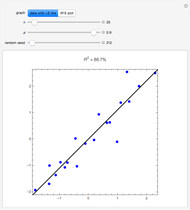 Residual-Fit Spread Plot
Ian McLeod Informal Power Assessment of the Normal Probability Plot
Ian McLeod Plotting a Long Time Series
Ian McLeod Comparing Regression Models with and without Data Transformation
Vincent Shatlock and Autar Kaw Symmetrizing Positive Random Variables
Ian McLeod Dot Plot
Craig Bauling Data Smoothing
Jon McLoone Grouping Country Data
Seth J. Chandler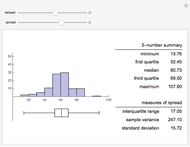 Descriptions of Univariate Data
Chris Boucher
-
 Rank Transform in Harmonic Regression Time Series
Ian McLeod -
 Detecting Periodicity in Short Time Series
Ian McLeod -
 Tempered Fractionally Differenced White Noise
Ian McLeod -
 Regression toward the Mean
Ian McLeod -
 Spread-Location Regression Diagnostic Check
Ian McLeod -
 Anscombe Quartet
Ian McLeod -
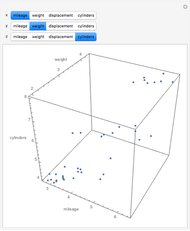 Visualizing Higher-Dimensional Data with 3D Scatterplots
Ian McLeod -
 Mean, Fitted-Value, Error, and Residual in Simple Linear Regression
Ian McLeod -
 Estimating and Diagnostic Checking in Censored Normal Random Samples
Ian McLeod -
 Comparing Gamma and Log-Normal Distributions
Ian McLeod -
 Monte Carlo Expectation-Maximization (EM) Algorithm
Ian McLeod -
 Comparing Exact and Approximate Censored Normal Likelihoods
Ian McLeod -
 Transformation to Symmetry of Gamma Random Variables
Ian McLeod -
 Illustrating the Central Limit Theorem with Sums of Bernoulli Random Variables
Ian McLeod -
 Hidden Correlation in Regression
Ian McLeod -
Informal Power Assessment of the Normal Probability Plot
Ian McLeod -
 Time Series for Power-Law Decay
Ian McLeod -
 Block Bootstrap for Time Series
Ian McLeod -
 Fractional Gaussian Noise
Ian McLeod -
Plotting a Long Time Series
Ian McLeod