Exploring Skewness in Box Plots


Requires a Wolfram Notebook System
Interact on desktop, mobile and cloud with the free Wolfram Player or other Wolfram Language products.
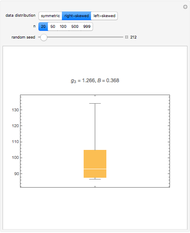
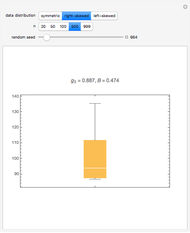
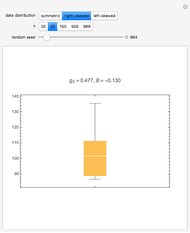
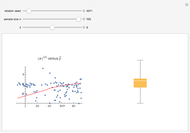
The box-and-whisker plot, also known simply as the box plot, is useful in visualizing skewness or lack thereof in data. The usual form of the box plot, shown in the graphic, shows the 25% and 75% quartiles,  and
and  , at the bottom and top of the box, respectively. The median,
  , is shown by the horizontal line drawn through the box. The whiskers extend out to the extremes. For brevity, the whiskers at the top and bottom are referred to as the positive and negative whiskers.


Contributed by: Ian McLeod (March 2011)
Open content licensed under CC BY-NC-SA
Snapshots


Details
A beta distribution with parameters (0.3, 0.8) is used for the case of positive skewness and (0.8, 0.3) in the negative case. The skewness coefficient is ±0.95. All data is scaled so the distribution mean and standard deviation are 100 and 15, respectively. In the symmetric case, the normal distribution is used.
In the present simulations, the quartile skewness is not as reliable as the usual skewness coefficient. This is to be expected when the third moment exists. With financial data, infinite variance distributions are sometimes used [1] and in this case the quartile skewness may be expected to provide a more reliable estimate.
[1] J.-W. Lin and A. I. McLeod, "Portmanteau Tests for ARMA Models with Infinite Variance," Journal of Time Series Analysis, 29(3), 2008 pp. 600–617.
Permanent Citation
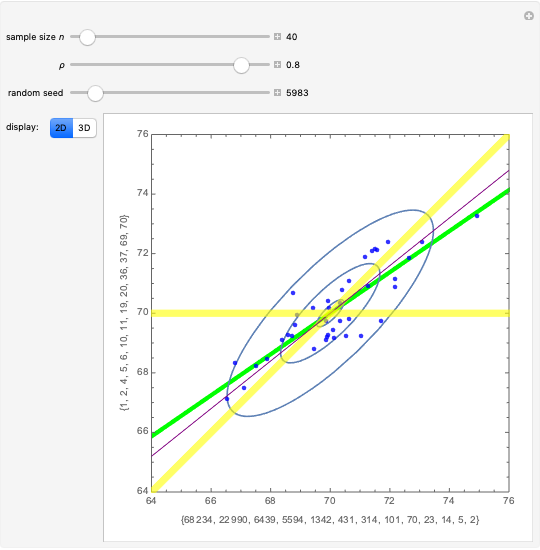
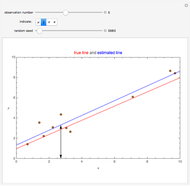
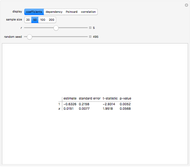
 Correlation and Regression Explorer
Ian McLeod (The University of Western Ontario)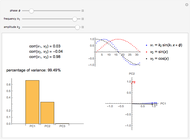 Loading Plot of a Principal Component Analysis (PCA)
D. Meliga and S. Z. Lavagnino Exploring Multivariate Data
Danny Turner (Winthrop University) Exploring Measures of Association
Jeff Hamrick Line Plots, Histograms, and Stem-and-Leaf Plots
Sarah Lichtblau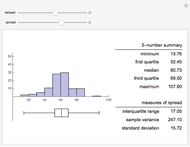 Descriptions of Univariate Data
Chris Boucher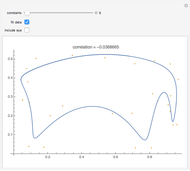 Fitting an Elephant
Roger J. Brown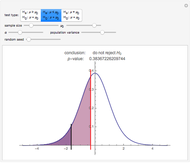 Hypothesis Tests about a Population Mean
Chris Boucher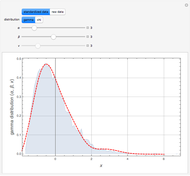 Edgeworth Expansion for Near-Normal Data
Housam Binous, Mamdouh Al-Harthi, and Brian G. Higgins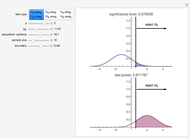 The Power of a Test Concerning the Mean of a Normal Population
Chris Boucher
-
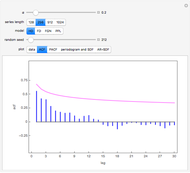
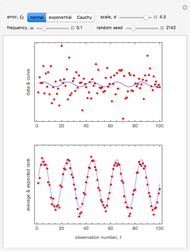 Rank Transform in Harmonic Regression Time Series
Ian McLeod -
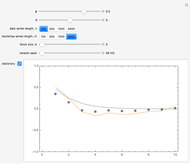
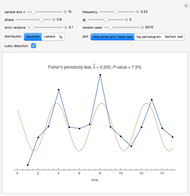 Detecting Periodicity in Short Time Series
Ian McLeod -
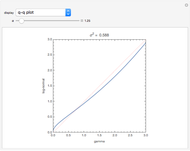
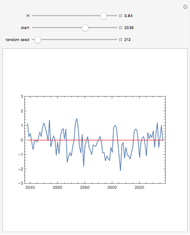
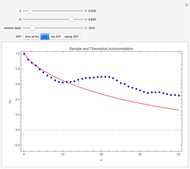 Tempered Fractionally Differenced White Noise
Ian McLeod -
 Regression toward the Mean
Ian McLeod -
 Spread-Location Regression Diagnostic Check
Ian McLeod -
 Anscombe Quartet
Ian McLeod -
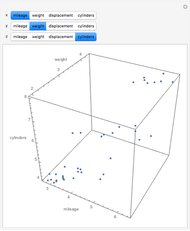 Visualizing Higher-Dimensional Data with 3D Scatterplots
Ian McLeod -
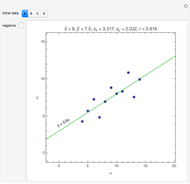
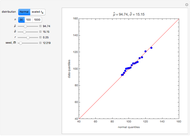
 Mean, Fitted-Value, Error, and Residual in Simple Linear Regression
Ian McLeod -
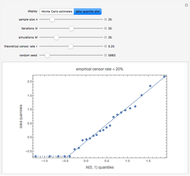
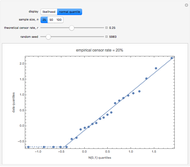
 Estimating and Diagnostic Checking in Censored Normal Random Samples
Ian McLeod -
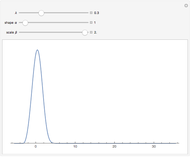
 Comparing Gamma and Log-Normal Distributions
Ian McLeod -
 Monte Carlo Expectation-Maximization (EM) Algorithm
Ian McLeod -
 Comparing Exact and Approximate Censored Normal Likelihoods
Ian McLeod -
 Transformation to Symmetry of Gamma Random Variables
Ian McLeod -
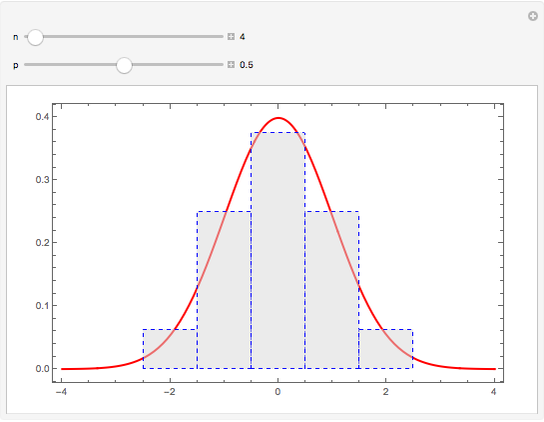 Illustrating the Central Limit Theorem with Sums of Bernoulli Random Variables
Ian McLeod -
 Hidden Correlation in Regression
Ian McLeod -
 Informal Power Assessment of the Normal Probability Plot
Ian McLeod -
 Time Series for Power-Law Decay
Ian McLeod -
 Block Bootstrap for Time Series
Ian McLeod -
 Fractional Gaussian Noise
Ian McLeod -
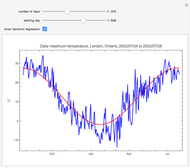 Plotting a Long Time Series
Ian McLeod