Feedback Control in an Activated Sludge Reactor

Requires a Wolfram Notebook System
Interact on desktop, mobile and cloud with the free Wolfram Player or other Wolfram Language products.
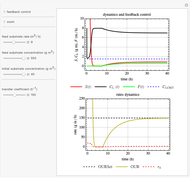
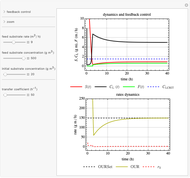
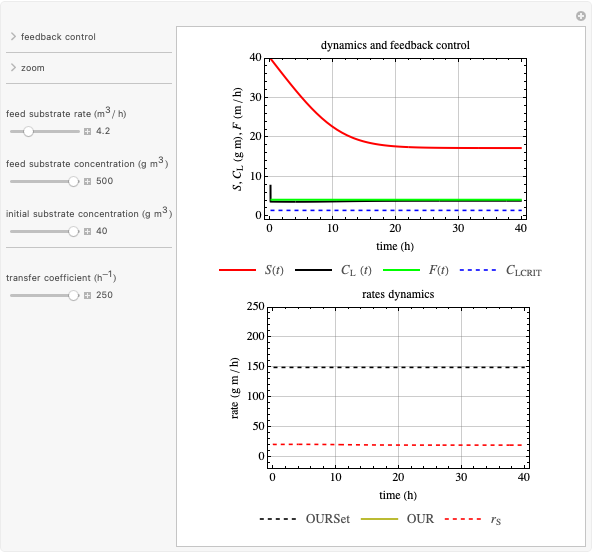
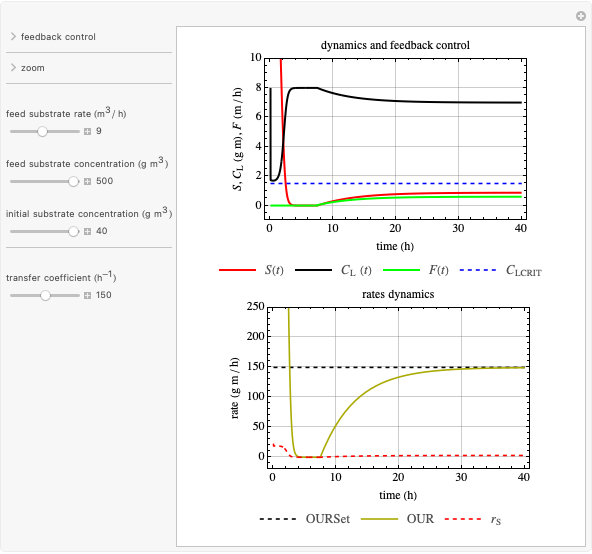
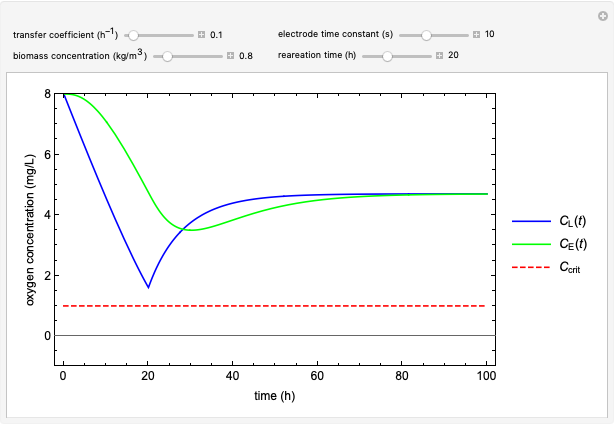
This Demonstration considers a model for the dynamics of a continuous reactor for treating an inhibitory substrate. The degradation rate is influenced by the concentrations of both the substrate and the dissolved oxygen, which are measured by an electrode. The biomass concentration is assumed constant, maintained in a sedimentation tank. Liquid phase balances for both the substrate and the dissolved oxygen are essential aspects of the model. This is important since the reactor is designed to avoid high concentrations of substrate, which would cause inhibitory behavior. This is accomplished by feeding the substrate at controlled flow rates, ensuring that the substrate concentration does not become too high.
Contributed by: R. Ricardo Sánchez (January 2023)
Open content licensed under CC BY-NC-SA
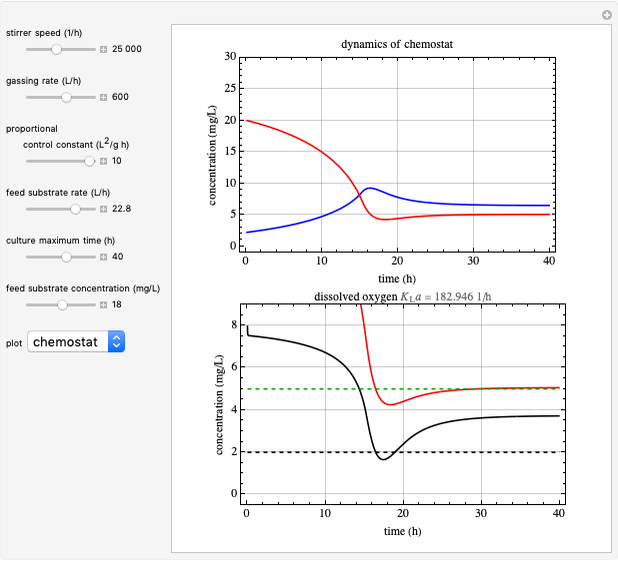
Snapshots


Details
Notation
 : substrate concentration
 : inhibition constant
 : maximum reaction velocity
 : saturation constant
 : oxygen saturation constant
 : dissolved oxygen concentration
 : critical dissolved oxygen concentration
 : dissolved oxygen saturation concentration or solubility of oxygen in the broth
 : feed substrate rate
 : proportional control constant
 : integral control constant
  )
)
 : derivative control constant
  )
)
 : set value for oxygen uptake rate
 : oxygen uptake rate
 : transfer coefficient
  )
)
 : reaction rate for substrate
 : reaction rate for oxygen
 : Yield coefficient, oxygen to substrate
Kinetic parameters
Inhibitory substrates at high concentrations reduce the maximum reaction velocity, below that predicted by a kinetic equation. The inhibition function may be expressed empirically as:
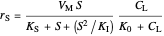 .
.
If substrate concentrations are low, the term  is lower in magnitude than
  and
and  , and the inhibition function reduces to the double Monod equation. You can observe the inhibition effect on oxygen uptake rate and the dissolved oxygen concentration.
Oxygen transfer
The oxygen mass transfer rate  can be represented by:
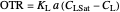 .
.
Oxygen uptake rate
The oxygen uptake rate  can be represented by:
 and
and  .
.
Control process
Proportional, integral and derivative control of the feed rate can be set by:
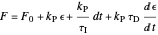
where  is the error and is represented by
  . If
. If  , then
  =
=  and the process runs out of control.
Reference
[1] J. B. Snape, I. J. Dunn, J. Ingham and J. E. Prenosil, Dynamics of Environmental Bioprocesses: Modelling and Simulation, New York: VCH, 1995.
Permanent Citation
 Feedback Control in a Stirred-Tank Reactor
R. Ricardo Sánchez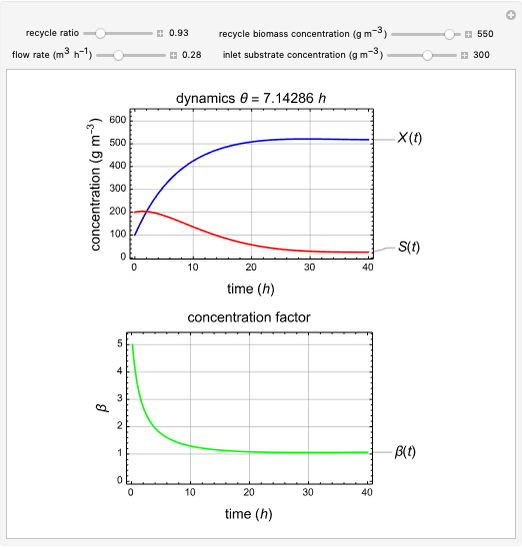 Continuous Stirred Tank Reactor with Activated Sludge Recycle
R. Ricardo Sánchez Proportional Temperature Control
Jeff Bryant First-Order Transfer Functions in Process Control
Simon M. Lane Elementary Model for Nuclear Fission Reactor
Pierre Albarède Minimized Volume for Reactors in Series
Nicholas R. Larson Feedback Control of Cellular Concentration in a Continuous Bioreactor (Turbidostat)
R. Ricardo Sánchez Autothermal Reactor
Rachael L. Baumann Reactor Steady States
Brian G. Higgins Reactor Design Economics
Rachael L. Baumann and Garrison J. Vigil
-
 Feedback Control in an Activated Sludge Reactor
R. Ricardo Sánchez -
Continuous Stirred Tank Reactor with Activated Sludge Recycle
R. Ricardo Sánchez -
 Activated Sludge Process in a Batch Reactor
R. Ricardo Sánchez -
 Penicillin Production in a Fed-Batch Bioreactor
R. Ricardo Sánchez -
Feedback Control of Cellular Concentration in a Continuous Bioreactor (Turbidostat)
R. Ricardo Sánchez -
 Oxygen Dynamics in a Chemostat with Substrate Inhibition
R. Ricardo Sánchez -
 Dynamics of an Enzymatic Aerated Reactor
R. Ricardo Sánchez -
 Startup and Steady State in a Chemostat
R. Ricardo Sánchez -
 Purity and Yield in Chromatography on Antibodies
R. Ricardo Sánchez -
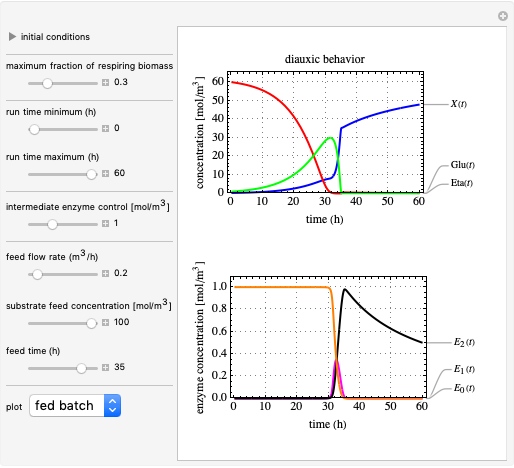 Diauxic Behavior of Yeast in a Fed-Batch Reactor
R. Ricardo Sánchez -
Feedback Control in a Stirred-Tank Reactor
R. Ricardo Sánchez -
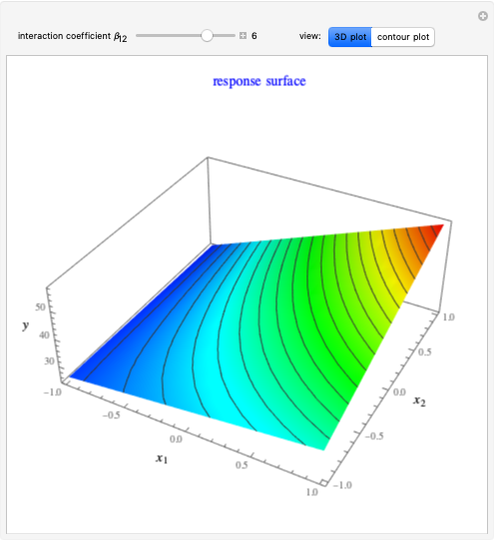 Interaction in a Two-Factor Regression Model
R. Ricardo Sánchez -
 Aeration Dynamics in a Batch Reactor
R. Ricardo Sánchez -
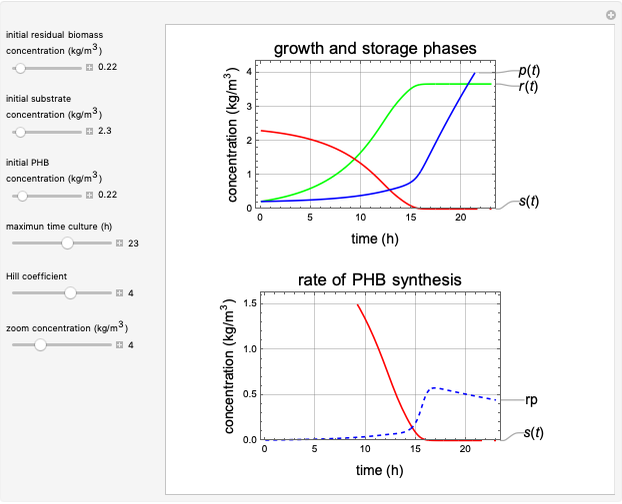 Structured Model for Intracellular PHB Production
R. Ricardo Sánchez -
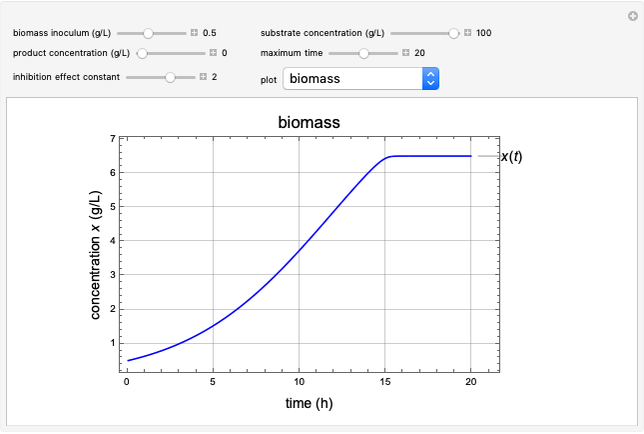 Batch Fermentation with Product Inhibition
R. Ricardo Sánchez -
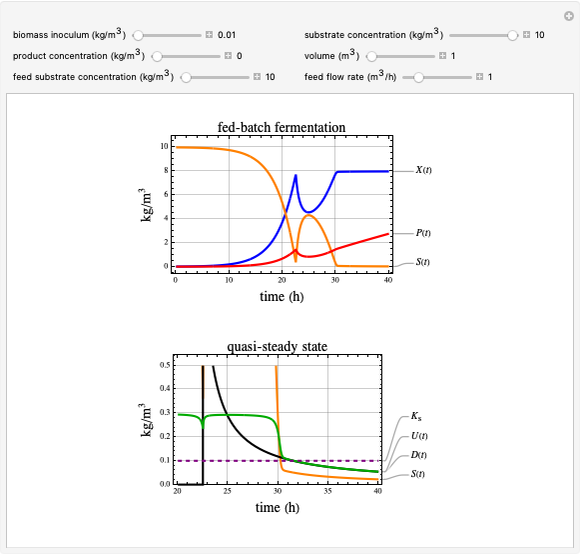 Fed-Batch Fermentation and Quasi-steady State
R. Ricardo Sánchez