Fluids in the Critical Region


Requires a Wolfram Notebook System
Interact on desktop, mobile and cloud with the free Wolfram Player or other Wolfram Language products.
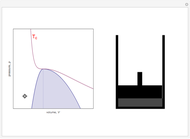
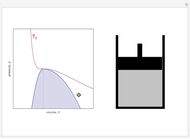
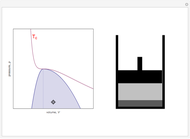
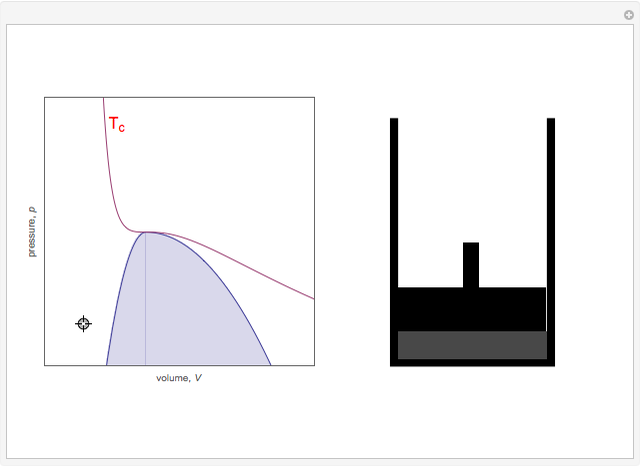
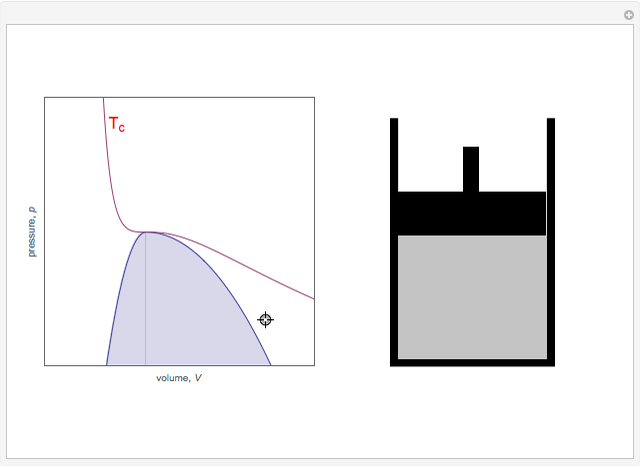
On the left is a phase diagram of the critical region of a representative fluid. Within the shaded area, the fluid separates into two phases: liquid and gas. The critical isotherm is also shown, labeled by the critical temperature  . At the critical point, this isotherm is tangent to the two-phase region. A gas can be liquefied only after it is cooled below its critical temperature.
Contributed by: S. M. Blinder (March 2011)
Open content licensed under CC BY-NC-SA
Snapshots
Details
Snapshot 1: This state would be identified as a liquid at a given pressure.
Snapshot 2: At a much higher temperature, the system would be a gas at the same pressure.
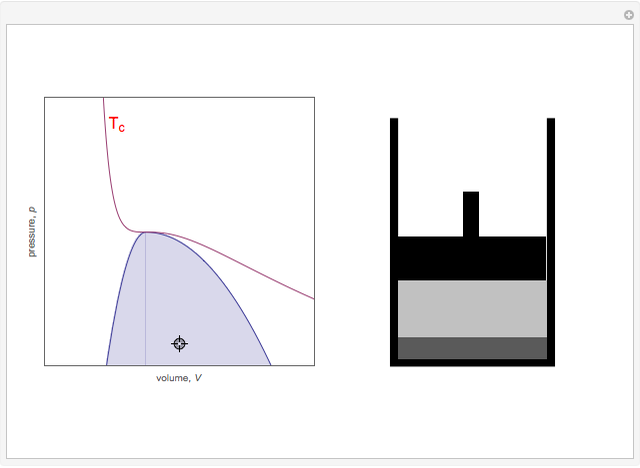
Snapshot 3: Going from state 1 to state 2 at constant pressure, the system would go through the two-phase region.
Snapshot 4: An alternative way to go from state 1 to state 2 would be to follow a path around the critical point. The same final state would then be attained continuously, without any phase separation. This is known as the principle of continuity of states.
Snapshot 5: As the critical point is approached, the densities of the two phases approach one another.
Snapshot 6: The densities become equal at the critical point.
Reference: S. M Blinder, Advanced Physical Chemistry; A Survey of Modern Theoretical Principles, New York: Macmillan, 1969 p. 134.
Permanent Citation
"Fluids in the Critical Region"
http://demonstrations.wolfram.com/FluidsInTheCriticalRegion/
Wolfram Demonstrations Project
Published: March 7 2011
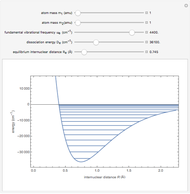 Energy Levels of a Morse Oscillator
S. M. Blinder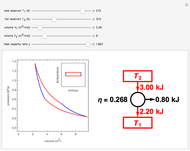 Carnot Cycle on Ideal Gas
S. M. Blinder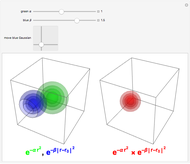 Product of Two Gaussians
S. M. Blinder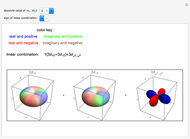 Linear Combinations of d Orbitals
Lisa M. Goss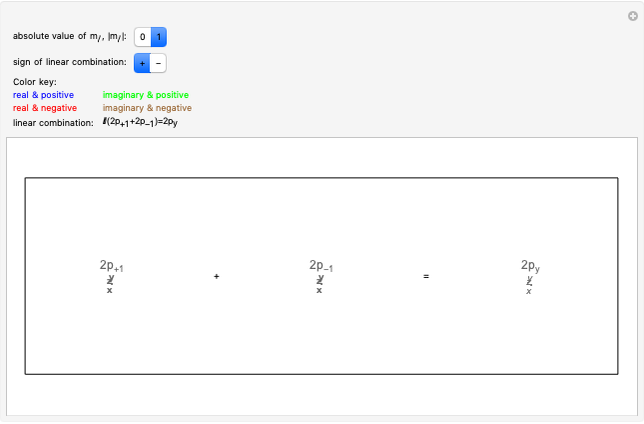 Linear Combinations of p Orbitals
Lisa M. Goss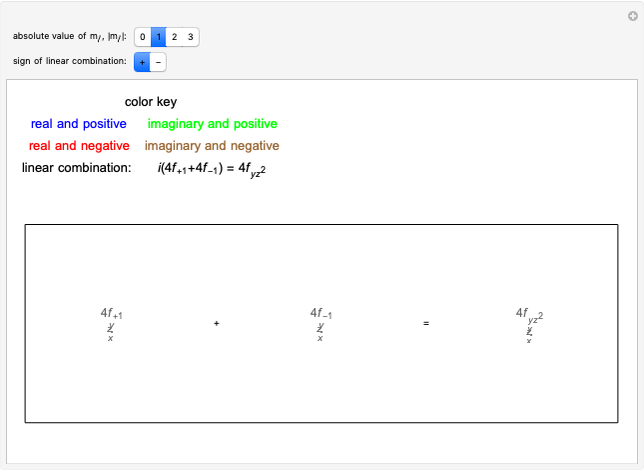 Linear Combinations of f Orbitals
Lisa M. Goss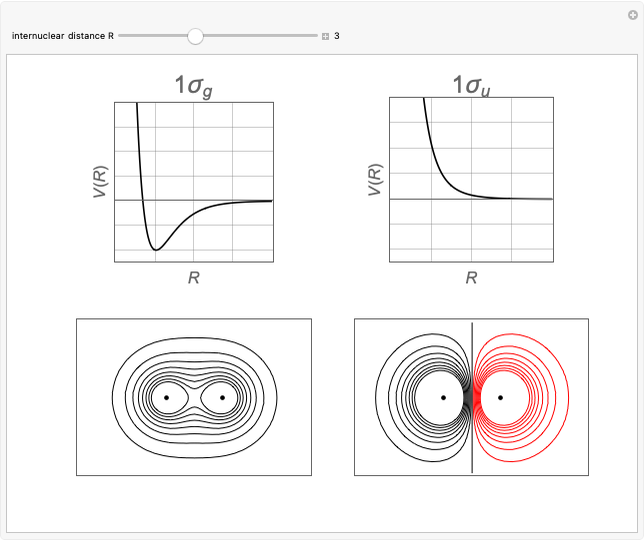 Bonding and Antibonding Molecular Orbitals
S. M. Blinder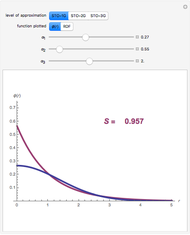 Gaussian Approximations to 1s Slater-Type Orbitals
S. M. Blinder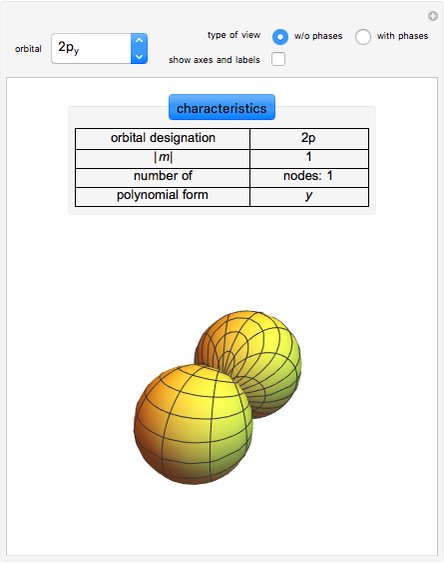 Visualizing Atomic Orbitals
Guenther Gsaller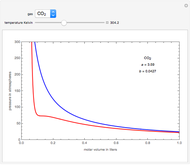 Van der Waals' Equation of State for a Non-Ideal Gas
Zach Heuman (Boise State University)
-
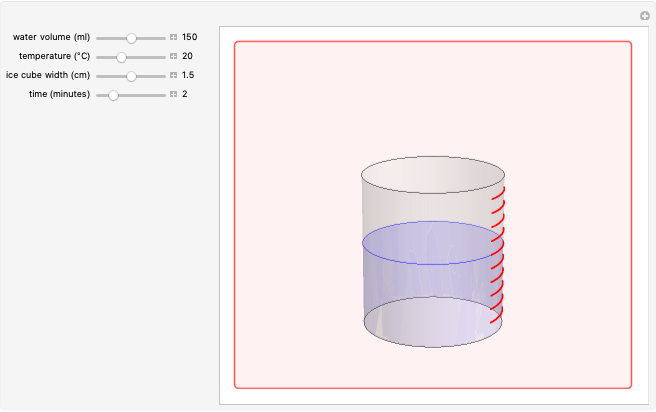 Ice Cube Melting in Water
S. M. Blinder -
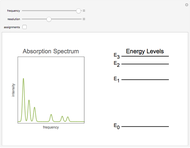 Absorption Spectroscopy
S. M. Blinder -
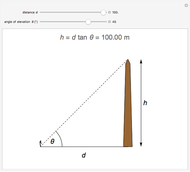 Height of Object from Angle of Elevation Using Tangent
S. M. Blinder -
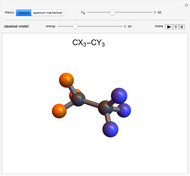 Internal Rotation in Ethane and Substituted Analogs
S. M. Blinder -
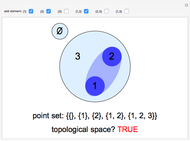 Topological Spaces on Three Points
S. M. Blinder -
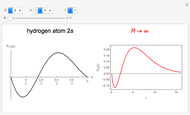 Hydrogen Atom in Curved Space
S. M. Blinder -
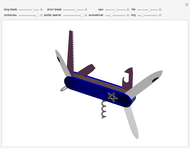 Multipurpose Tool
S. M. Blinder -
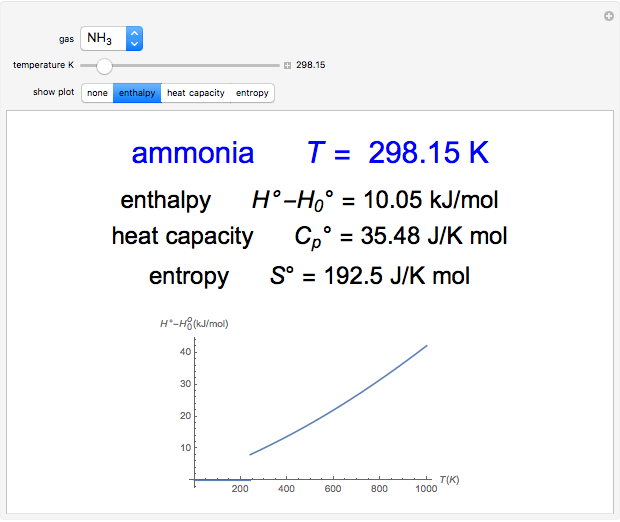 Statistical Thermodynamics of Ideal Gases
S. M. Blinder -
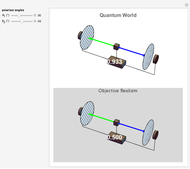 Bell's Theorem
S. M. Blinder -
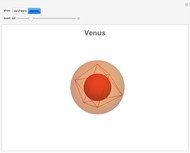 Kepler's Mysterium Cosmographicum
S. M. Blinder -
Bonding and Antibonding Molecular Orbitals
S. M. Blinder -
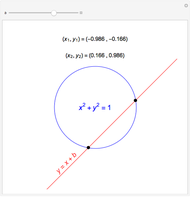 Visible and Invisible Intersections in the Cartesian Plane
S. M. Blinder -
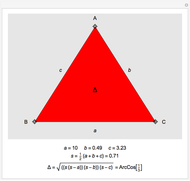 Heron's Formula
S. M. Blinder -
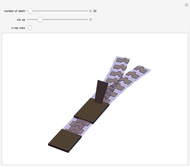 How Zippers Work
S. M. Blinder -
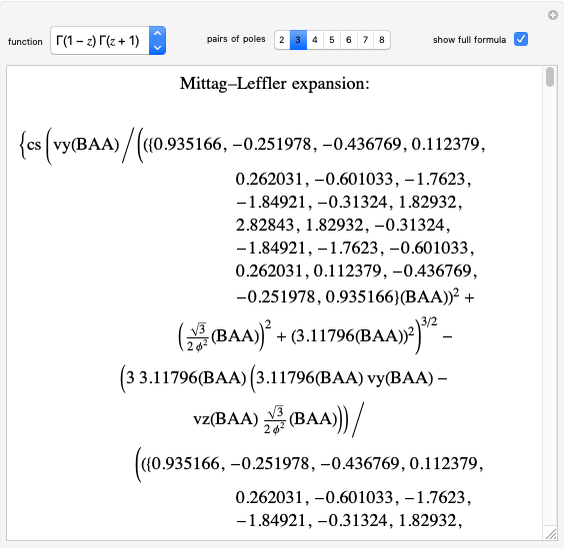 Mittag-Leffler Expansions of Meromorphic Functions
S. M. Blinder -
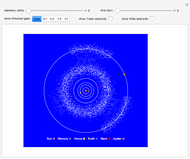 Orbital Resonance in the Asteroid Belt
S. M. Blinder -
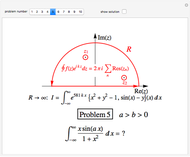 Jordan's Lemma Applied to the Evaluation of Some Infinite Integrals
S. M. Blinder -
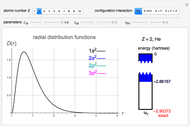 Configuration Interaction for the Helium Isoelectronic Series
S. M. Blinder -
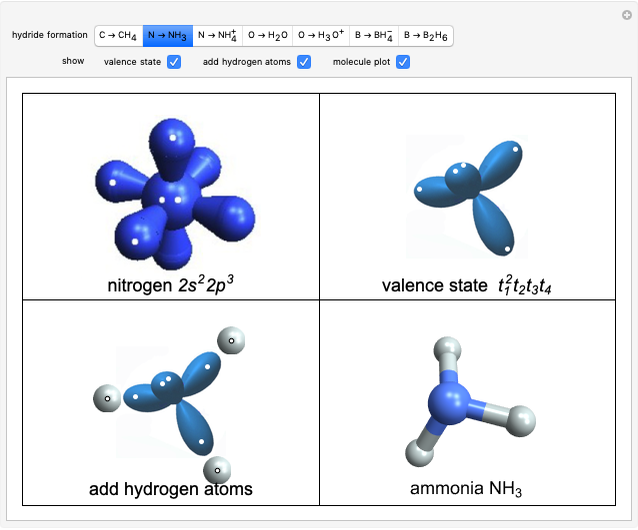 Structure and Bonding of Second-Row Hydrides
S. M. Blinder -
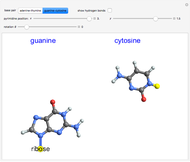 DNA Base Pairing
S. M. Blinder