Effect of High Expense Charges on an Investment's Net Return


Requires a Wolfram Notebook System
Interact on desktop, mobile and cloud with the free Wolfram Player or other Wolfram Language products.
The net yield of a long-term investment primarily depends on an effective interest return rate and the way in which it is compounded. However, the actual yield also heavily depends on the total expense rate charged to maintain the account, which typically ranges from a fraction of a percent to a few percent. The expense rate can have a huge accumulated effect as time goes on. This Demonstration generates and plots investment value versus time curves at various effective return rates. Both the low and high expense rates, with various effective compounding frequencies, are shown in scenarios where regular fixed contributions may be added periodically to the original investment amount. The difference between the gross and net yields at both low and high expense rates is calculated and tables are generated that show the yield after different combinations of holding times, return rates and expense rates.
Contributed by: Mark D. Normand (April 2017)
Open content licensed under CC BY-NC-SA
Snapshots


Details
Snapshots
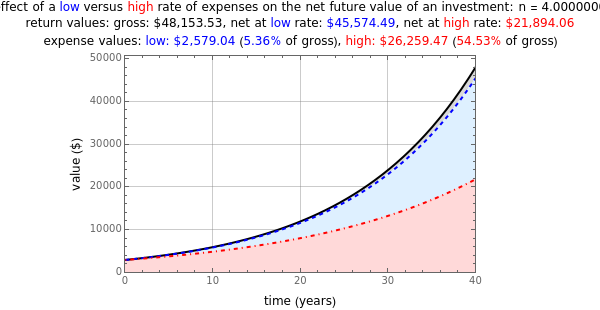
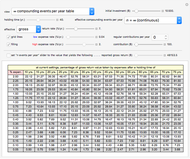
Snapshot 1: Growth curve (plotted as a solid black line) of a $10,000 investment over a holding time of 40 years with no added contributions at a 7% effective gross return rate compounded continuously. It also shows growth curves at two expense rates, low (0.04%, dashed line plotted in blue) and high (2%, dash-dot line plotted in red).
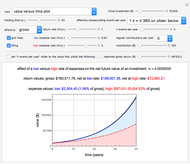
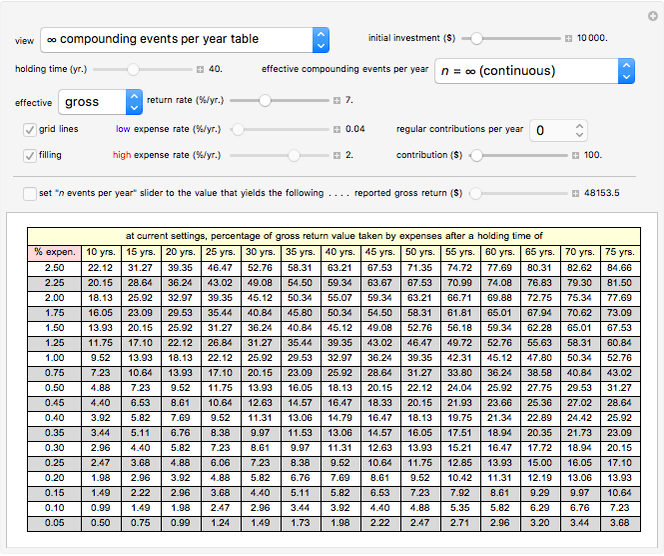
Snapshot 2: Table showing the conditions from Snapshot 1 (continuous compounding at a 7% effective gross return rate with no added contributions) that contains 18 different expense rate percentage rows ranging from 0.05% to 2.5% and 14 different holding time columns ranging from 10 to 75 years in 5-year increments. Note that when the number of regular contributions per year is set to 0 and continuous compounding is chosen, a change to either the initial amount or effective gross return rate slider does not affect any of the compounding table's percentage entries. Snapshots 1 and 2 represent theoretical maximum compounding scenarios that are unlikely to be encountered in reality.
Snapshot 3: Growth curve (plotted as a solid black line) of a $10,000 investment over a holding time of 40 years with no added contributions at a 7% effective gross return rate compounded annually (1 time/year). It also shows growth curves at two expense rates, low (0.04%, dashed line plotted in blue) and high (2%, dash-dot line plotted in red).
Snapshot 4: Growth curve (plotted as a solid black line) of a $10,000 investment over a holding time of 40 years with no added contributions at a 8.96% effective gross return rate compounded annually. It also shows growth curves at two expense rates, low (0.04%, dashed line plotted in blue) and high (2%, dash-dot line plotted in red). Note that the net yield returned to the investor at a high 2% expense rate ($158,007.36 shown in red on line 2 above the plot) in Snapshot 4 is exactly the same as the low expense rate net yield amount (shown in blue on line 2 above the plot) from Snapshot 3. This shows that a fund charging a 2% expense rate needs to produce an effective gross return rate of 8.96% for 40 years to yield the same net amount to the investor as did a fund that had a 7% gross return rate but charged only a 0.04% expense rate over those 40 years.
Explanation of Terms
The actual (net) yield to the investor of a long-term investment, with or without periodic additional deposits, can be dramatically influenced by the expense rate charged to maintain the account. This Demonstration calculates an investment's growth under various hypothetical conditions and highlights the difference between the gross yield without expenses and the actual yield after their subtraction. It should be noted that the total expense rate must include all expenses and fees that are charged for maintenance of the account, since all such charges cause a reduction in the net yield of the account to the investor. The effective return rate and the expense rate (also called "expense ratio") are typically reported as percentages in a fund's quarterly investment report of past performance and in the fund's prospectus of future performance. The return rate reported may be the gross return rate (the rate before the expense rate has been subtracted) or the net return rate (the rate after either the low or the high expense rate has been subtracted). If those percentages are not readily available, it is reasonable to assume the fund managers are attempting to conceal a high expense rate.
It must be emphasized that a fund's expense percentage rate is not the percentage of the total gross return of that fund at the end of its holding time (e.g. a reported 2% expense rate does not mean that 2% out of the 100% of a fund's gross return at the end of a typical 40-year holding time is the percentage lost to expenses). A reported 2% expense rate also does not represent a linear fraction of the effective gross return rate percentage of the fund (e.g., for a fund whose gross return rate is 7% but which charges a 2% expense rate, 2/7% is ~28.57%, which is still much less than the actual percentage taken by expenses after 40 years). In fact, the reported expense percentage is a percentage rate that should be subtracted from the effective gross return rate percentage and the difference then used to compute the actual net yield of the fund to the investor at that lower rate. For example, a fund that has an effective gross return rate of 9% but charges a 2% expense rate is actually only returning a net yield rate of 7% to the investor, which after a holding time equal to a typical working lifetime of 40 years can easily represent more than 50% of the total gross return value of the fund, as shown in the Thumbnail image and also as illustrated in Snapshots 3 and 4.
Because all money earned by a typical investment fund is automatically reinvested in the fund, the value of the fund increases over time by the same process as the accumulation of compound interest in a bank savings account. The upper limit of that process is described by the equation  where
where  is the number of compounding events per year and
  is Euler's constant, the base of the natural logarithm (~2.718281828459…). The future value
  of an amount
  invested in an account that compounds continuously at an annual interest rate
  over
over  years is
  .
.
Use of Manipulate Control Items
Use the "view" popup menu to choose the plot or table display mode. Use the "initial investment ($)" slider to set the investment's initial deposit amount (in US dollars). Enter the investment's holding time (in years) using its slider. The investment's reported effective return rate (either gross, net after subtraction of the entered low expense rate or net after subtraction of the entered high expense rate) is chosen from a popup menu and the effective return rate value (in %/yr.) is entered with a slider. Two total expense rates, one specifying a low rate (in blue) and another a high rate (in red) and both in units of %/yr., are entered with sliders.
From the "regular contributions per year" popup menu, the number of regular periodic contributions per year may be selected from the following choices: 0, 1, 2, 3, 4, 6, 12, 26, 52, and the chosen amount to be regularly contributed is specified by the "contribution ($)" slider.
Whether or not the region below the red or blue curve is filled in with the corresponding color and whether or not a grid of lines is drawn on the plot are controlled by the "filling" and "grid lines" checkboxes, respectively.
The solid black growth curve in the "value versus time plot" is that of the investment's gross return, and the dashed blue curve is that of the investment's growth after low total expenses have been subtracted. The dashed red curve is that of the investment's growth after high total expenses have been subtracted. The distance between each dashed curve and the solid black curve represents the investor's loss in expenses to each fund's management, both of which can increase exponentially with time.
Note that the number that appears to the right of all sliders is rounded to six digits even if more digits were entered. However, the actual value entered is preserved in the program.
Typical Examples
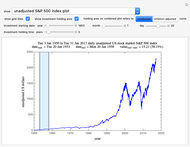
To include a typical example of a fund with a low expense rate, the default Thumbnail image setting of 3000. for the "initial amount ($)" slider shows the minimum investment amount in a stock index fund that tracks the S&P 500 stock market index. The default value of 7% for the "effective gross return rate (%/yr.)" slider is the approximate return rate of such a fund over the past 10 years, and the "low expense rate (%/yr.)" value of 0.14% is the expense rate of that fund for an investment of less than $10,000. Some such funds automatically reduce the expense rate to 0.04% when more than $10,000. has been accumulated in the fund. A "high expense rate (%/yr.)" control value of 2% is typical of that found in many funds offered as 401(k) or 403(b) retirement accounts. Notice that an expense rate of 2% is 50 times higher than a rate of 0.04% and that for an investment held for a long time, even a much smaller difference in the expense rates results in a very large difference in the net return to the investor.
A common retirement account marketing strategy that can increase but obfuscate expense rates is to offer a portfolio of funds targeting different investment categories or market sectors. A portfolio account requires the investor to pay management expenses for several funds instead of just one. In such cases, this Demonstration can be used to evaluate expenses for each fund separately. Information for each fund can be found online by using the fund's ticker symbol (e.g. VFINX) to be sure you have located the correct fund.
Limitations of This Demonstration
This Demonstration only describes scenarios where the effective interest rate and additional deposits' magnitude and frequency are fixed for the investment's duration and it does not consider inflation or taxes. Yet, it shows that although a commonly charged expense rate is typically expressed as a small percentage, its accumulation over the years can reduce the investment's net yield to the investor by a huge amount.
The maximum amount charged to expenses happens when no additional contributions are made after the initial deposit (choose 0 with the "regular contributions per year" popup menu). This is because every invested dollar is subjected to the expense rate charges for the entire time the fund is held. This situation is exacerbated by a high expense rate and a high rate of compounding, of which continuous compounding is the theoretical upper limit. A hypothetical extreme example is shown in Snapshot 1 and in the table in Snapshot 2. In that table, notice that for a 40-year holding time at a 2% expense rate, 55.07% of the fund's gross return value is taken by expenses. Because this loss increases exponentially over time, after 50, 60 and 70 years the percentage of the fund's gross return taken by expenses rises to 63.21%, 69.88% and 75.34%, respectively.
Advice to Avoid Long Calculation Times
To avoid long calculation times when changing control settings it is best to:
1. Set the "regular contributions per year" popup menu to 0 before changing any other controls.
2. Make changes to all other controls except for the "view" menu.
3. Reset the "regular contributions per year" popup menu if it is other than 0.
4. If you choose a table display, make the " compounding events per year table" item from the "view" popup menu the very last control to be changed. This is because 252 calculations are displayed in the table, making it take longer to compute than other control changes.
Permanent Citation
 Fate of a Long-Term Index Fund Investment According to the S&P 500
Mark D. Normand The Effect of Holding Period on Real Estate Investment Return
Roger J. Brown Investment Leverage Effect
Michael Schreiber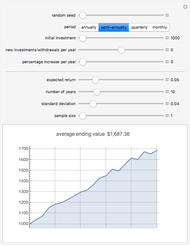 Investment Returns
Jason Cawley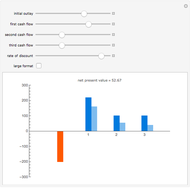 Net Present Value
Fiona Maclachlan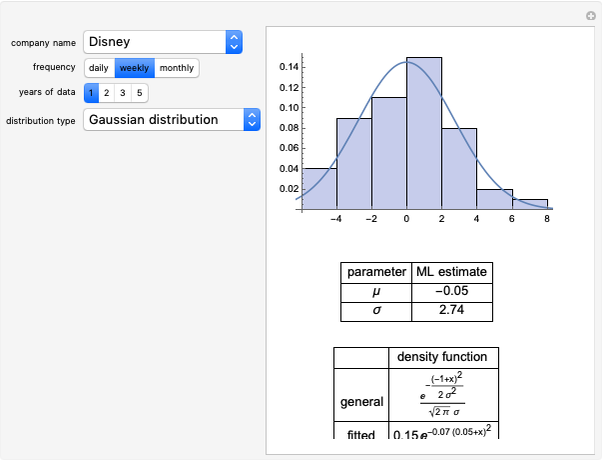 Modeling Return Distributions
Jeff Hamrick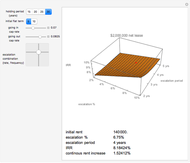 Net Lease Economics
Roger J. Brown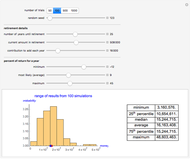 Monte Carlo Simulation of Retirement Savings with Variable Annual Return
Paul Savory (University of Nebraska-Lincoln)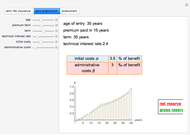 Net and Gross Reserve of Life Insurance
Gergely Nagy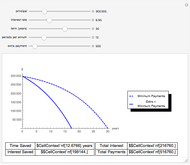 Effect of Extra Payments on an Amortizing Loan
Ben Carbery
-
 Gordon-Taylor and Fox Equations for Glass Transition Temperature
Mark D. Normand -
 Force to Overcome Vacuum Pull
Mark D. Normand -
 Extending the Square Root Growth Rate Model to Lethal Low Temperatures
Mark D. Normand -
 Probability of Being Strange According to Paulos
Mark D. Normand -
 Successive Three-Point Method for Weibullian Chemical Degradation
Mark D. Normand -
 Effect of High Expense Charges on an Investment's Net Return
Mark D. Normand -
 Estimating Cohesion and Tensile Strength of Compacted Powders
Mark D. Normand -
 Three-Endpoints Method for Isothermal Weibullian Chemical Degradation
Mark D. Normand -
 Vitamin C Loss in Foods During Heat Processing and Storage
Mark D. Normand -
 Parameterizing Temperature-Viscosity Relations
Mark D. Normand -
Fate of a Long-Term Index Fund Investment According to the S&P 500
Mark D. Normand -
 Laplace Distribution in Fluctuating Stock Index Records
Mark D. Normand -
 Weibullian Chemical Degradation
Mark D. Normand -
 Simulating Ascorbic Acid Degradation
Mark D. Normand -
 Additive and Multiplicative Risks
Mark D. Normand -
 Endpoints Method for Predicting Chemical Degradation in Frozen Foods
Mark D. Normand -
 Exponential Model for Arrhenius Activation Energy
Mark D. Normand -
 Prediction of Isothermal Degradation by the Endpoints Method
Mark D. Normand -
 Risk Guesstimation from Factor Ranges
Mark D. Normand -
 Volatiles Formation Kinetics in Stored Fish
Mark D. Normand