Laplace Distribution in Fluctuating Stock Index Records

Requires a Wolfram Notebook System
Interact on desktop, mobile and cloud with the free Wolfram Player or other Wolfram Language products.
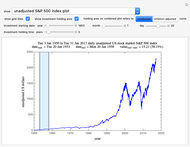
Historic Dow Jones Industrial Average (DJIA), NASDAQ composite or Standard and Poor's 500 (S&P 500) stock index records, whether before or after adjustment for inflation, can be viewed as random time series exhibiting short- and long-term fluctuations as well as trends of various durations. The long-term trends can be suppressed and the daily fluctuations separated from the trends by converting the individual daily entries into moving ratios, which have an approximately Laplace distribution. Because the Laplace distribution is symmetric around the mean and has inward concavity, its emergence implies that except for immediately after a dramatic drop or rise of the stock index, a large daily gain or loss is not only very rare but also has about the same probability.
Contributed by: Mark D. Normand and Micha Peleg (March 2017)
Open content licensed under CC BY-NC-SA
Snapshots
Details
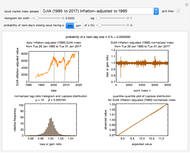
Snapshot 1: daily 1985 to 2017 Dow Jones Industrial Average inflation-adjusted 33-year record before and after its conversion to successive ratios ( ), the ratios's histogram on which the Laplace distribution has been superimposed and corresponding quantile-quantile plot
Snapshot 2: daily 1950 to 2017 S&P 500 unadjusted 68-year record before and after its conversion to successive ratios ( ), the ratios' histogram on which the Laplace distribution has been superimposed and corresponding quantile-quantile plot
Snapshot 3: Daily 1950 to 2017 S&P 500 unadjusted 68-year record before and after its conversion to successive ratios ( ), the ratios' histogram on which the Laplace distribution has been superimposed and corresponding quantile-quantile plot. Notice the differences between the three ratio plots from the corresponding plots in Snapshot 2 where
  .
.
Snapshot 4: Daily 1971 to 2000 NASDAQ 30-year record before the 2000 dot-com crash. The plots display the data before and after conversion to successive ratios ( ), the ratios' histogram on which the Laplace distribution has been superimposed and corresponding quantile-quantile plot.
Snapshot 5: Daily 2000 to 2008 NASDAQ 9-year record starting with the 2000 dot-com crash and ending with the 2008 housing market crash. The plots display the data before and after conversion to successive ratios ( ), the ratios' histogram on which the Laplace distribution has been superimposed and corresponding quantile-quantile plot.
Based on its historic record, whether unadjusted or inflation-adjusted, what is the probability that a daily stock index value will rise or fall by a given amount, for example, 5%, relative to its previous value? The question is not when this will happen but how frequently it might occur. A parametric approach to answering such a question was originally proposed and used to estimate the probabilities that an industrial microbial count will rise beyond or fall below any given level from count records that have a trend and/or periodicities [1]. Here, the method is being applied to historic DJIA, NASDAQ composite or S&P 500 records, which have clear trends, partly due to inflation, and periods of rise and fall that reflect the changing conditions in the economy. Also, all the data have been split into three segments marked by vertical gray lines: from the start to the "dot-com bubble" crash, from that crash to the housing market crash and then from that point onward.
To eliminate the role of long- and short-term trends, and that of regular or irregular periodicities, we have defined a daily ratio  , where
  is the
  entry value and
  .
.
Once the market index and lag have been selected, the original and converted records,  versus date and corresponding
  versus
  are plotted at the top of the graphical display, left and right, respectively. The calculated
  values' histogram is plotted at the bottom left, with its calculated Laplace distribution superimposed. The corresponding quantile-quantile plot is shown at the bottom right. Notice that for a dataset having a perfect Laplace distribution, the quantile-quantile plot would be a straight line with a slope of 45 degrees.
The calculated Laplace distribution's  and
and  are used to estimate the probability that a value of
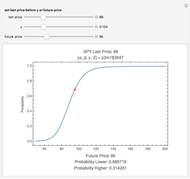
  will drop by a chosen loss level, for example, of 5%, as in the default, or have a gain level of the same magnitude. The corresponding probability of such an event is displayed above the top two plots.
This Demonstration shows that for  , the
, the  have a nearly symmetric Laplace distribution regardless of the market index type and its historic record's duration. This symmetry progressively disappears as the lag is increased and with it the local trends' manifestations. The emergence of the Laplace distribution indicates that the probability of deviation from the mean falls very rapidly with its magnitude. Thus, in all cases the displayed probability of a loss or gain
  exceeding about 10% is very close to zero.
The  plots of all three market indices show clusters or outbursts of high-amplitude fluctuations. Whether and how they are correlated with economic crises or political events is outside the scope of this Demonstration.
Notice that while the described procedure can be used to estimate the probability of a crash, it does not account for what immediately follows. Stock price fluctuations after a crash, at least for a while, are governed by different considerations and hence do not conform to the original distribution function. Also notice that in all three market indices, both unadjusted and inflation-adjusted, the mean value of  tends to be very slightly greater than 1.0000000, which indicates that in the long run the market index tends to increase.
Reference
[1] M. G. Corradini, R. Engel, M. D. Normand and M. Peleg, "Estimating the Frequency of Future High Microbial Counts in Records with Actual or Potential Trend or Periodicity," Journal of Food Science, 67(4), 2002 pp. 1278–1285. doi:10.1111/j.1365-2621.2002.tb10276.x.
Permanent Citation


