Endpoints Method for Predicting Chemical Degradation in Frozen Foods


Requires a Wolfram Notebook System
Interact on desktop, mobile and cloud with the free Wolfram Player or other Wolfram Language products.
The chemical degradation of nutrients and pigments in stored frozen foods frequently follows first-order or approximately first-order kinetics. If their concentration ratios after storage for times  and
and  at temperatures
  and
and  , respectively, are experimentally determined, then it is possible, at least in theory, to extract their kinetic parameters from these endpoints, assuming that the rate constant’s temperature dependence follows the simple exponential model (a convenient substitute for the traditional Arrhenius equation).
Contributed by: Mark D. Normandand Micha Peleg (June 2016)
Open content licensed under CC BY-NC-SA
Snapshots

Details
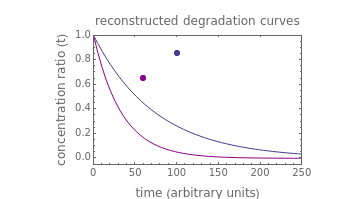
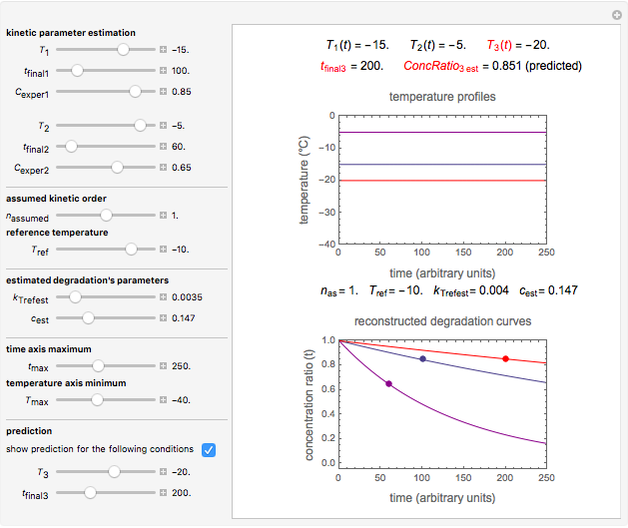
Snapshot 1: the two concentration ratios shown in the thumbnail matched manually with their corresponding generated degradation curves, assuming first-order kinetics ( )
)
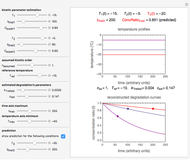
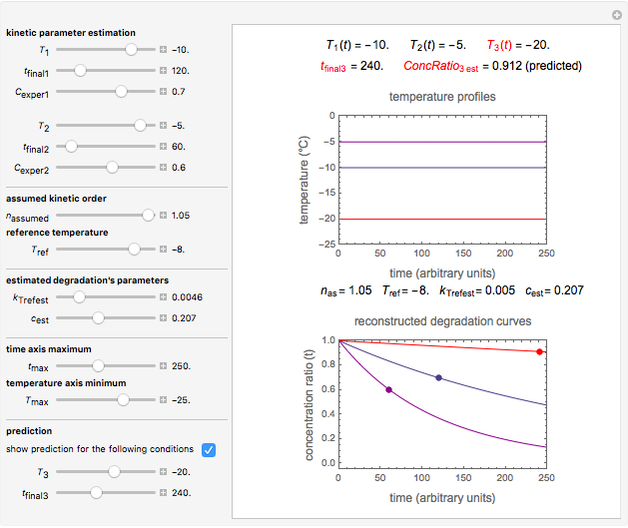
Snapshot 2: the same two concentration ratios matched manually, used to predict the degradation curve (red) at temperature  and the concentration at time
  (red point), assuming first-order kinetics ()
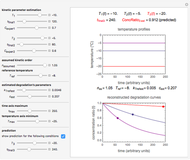
Snapshot 3: the use of manual matching parameters to predict the degradation curve (red) at temperature and the concentration at time (red point), assuming approximate first-order kinetics ( )
)
The degradation of vitamins or pigments in frozen foods frequently follows fixed-order kinetics of order  or
or  . The temperature dependence of the rate constant frequently follows the exponential model
  , where
  is the rate constant at temperature
  ,
,  is the rate constant at an arbitrary reference temperature
  , all temperatures are in degrees Celsius, and
  is a constant. This simpler model can replace the traditional Arrhenius equation without sacrificing the fit [1].
At two constant low temperatures and , the two corresponding degradation curves can be described by a pair of rate equations  and
and  , where the
  s are the corresponding concentration ratios. These rate equations' isothermal solutions for times
  and
and  are
are  and
and  , and they have to match the experimentally determined concentration ratios, i.e.
  and
and  . This creates two simultaneous equations, where the two unknowns are the exponential model's parameters and .
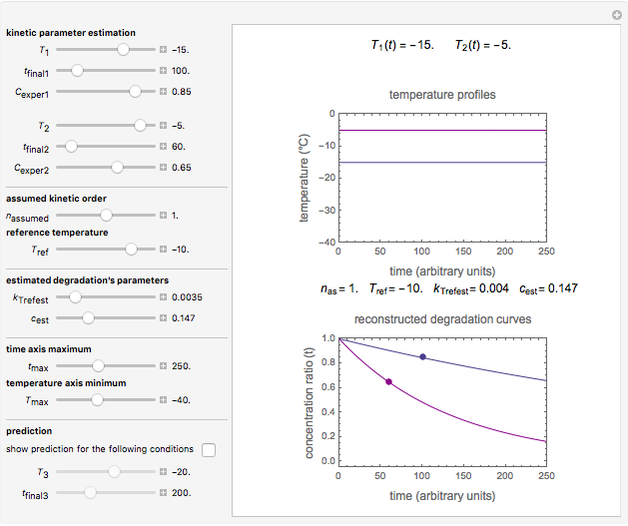
To do the calculation, enter the two frozen storage temperatures and  as negative numbers, corresponding to concentration ratios
  and
and  at the times and , the assumed reaction order
  (
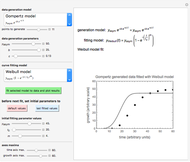
( ), and an arbitrary reference temperature , preferably between the two chosen temperatures. Once these parameters are set and displayed, try to match the two shown generated degradation curves with the two chosen endpoints by moving the
  and
and  sliders. The match can be more finely adjusted by changing the numerical values of these two parameters displayed to the right of the sliders.
When a satisfactory match is obtained, the corresponding and parameters' values, which are also displayed above the bottom plot, can be used as the initial guesses for solving the rate equations or considered as estimates of the parameters' values themselves. In that case, by checking the "show prediction for the following conditions" box, you can recreate the nutrient's degradation curve at any other selected frozen temperature (red curve) and estimate and display the concentration ratio at any chosen time entered with the slider.
Not all time-temperature-concentration ratio entries allowed by the program must have two matching degradation curves. Some entries may reflect experimental errors, a reaction kinetic order outside the permitted range, and/or nonlinear kinetics in the particular system.
References
[1] M. Peleg, M. D. Normand, and M. G. Corradini, "The Arrhenius Equation Revisited," Critical Reviews in Foods Science and Nutrition, 52(9), 2012 pp. 830–851. doi:10.1080/10408398.2012.667460.
[2] M. Peleg, M. D. Normand, and A. D. Kim, "Estimating Thermal Degradation Kinetics Parameters from the Endpoints of Non-isothermal Heat Processes or Storage," Food Research International, 66, 2014 pp. 313–324. doi:10.1016/j.foodres.2014.10.003.
[3] M. Peleg, M. D. Normand, and T. R. Goulette, "Calculating the Degradation Kinetic Parameters of Thiamine by the Isothermal Version of the Endpoints Method," Food Research International, 79, 2016 pp. 73–80. doi:10.1016/j.foodres.2015.12.001.
Permanent Citation
 Successive Three-Point Method for Weibullian Chemical Degradation
Mark D. Normand and Micha Peleg Extracting Fixed-Order Degradation Kinetics by the Endpoints Method
Mark D. Normand and Micha Peleg Weibullian Chemical Degradation
Mark D. Normand and Micha Peleg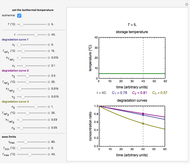 Thermal Degradation of Three Nutrients in Foods
Mark D. Normand and Micha Peleg Simulating Ascorbic Acid Degradation
Mark D. Normand and Micha Peleg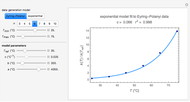 Eyring-Polanyi versus Exponential Model for Chemical Reactions
Mark D. Normand, Christina S. Barsa, and Micha Peleg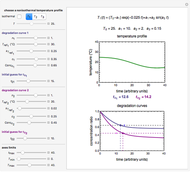 Determining Shelf Life by Two Criteria
Mark D. Normand and Micha Peleg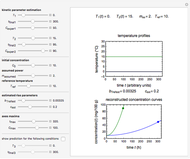 Volatiles Formation Kinetics in Stored Fish
Mark D. Normand and Micha Peleg Prediction of Isothermal Degradation by the Endpoints Method
Mark D. Normand and Micha Peleg Three-Endpoints Method for Isothermal Weibullian Chemical Degradation
Mark D. Normand and Micha Peleg
-
 Gordon-Taylor and Fox Equations for Glass Transition Temperature
Micha Peleg -
 Force to Overcome Vacuum Pull
Micha Peleg -
 Extending the Square Root Growth Rate Model to Lethal Low Temperatures
Micha Peleg -
 Probability of Being Strange According to Paulos
Micha Peleg -
Successive Three-Point Method for Weibullian Chemical Degradation
Micha Peleg -
 Estimating Cohesion and Tensile Strength of Compacted Powders
Micha Peleg -
Three-Endpoints Method for Isothermal Weibullian Chemical Degradation
Micha Peleg -
 Vitamin C Loss in Foods During Heat Processing and Storage
Micha Peleg -
 Parameterizing Temperature-Viscosity Relations
Micha Peleg -
 Laplace Distribution in Fluctuating Stock Index Records
Micha Peleg -
Weibullian Chemical Degradation
Micha Peleg -
Simulating Ascorbic Acid Degradation
Micha Peleg -
 Additive and Multiplicative Risks
Micha Peleg -
 Endpoints Method for Predicting Chemical Degradation in Frozen Foods
Micha Peleg -
 Exponential Model for Arrhenius Activation Energy
Micha Peleg -
Prediction of Isothermal Degradation by the Endpoints Method
Micha Peleg -
 Risk Guesstimation from Factor Ranges
Micha Peleg -
Volatiles Formation Kinetics in Stored Fish
Micha Peleg -
 Comparison of Six Sigmoid Growth Curve Models
Micha Peleg -
 Titration of Common Food Acids
Micha Peleg