Microbial Population Growth, Mortality, and Transitions between Them

Requires a Wolfram Notebook System
Interact on desktop, mobile and cloud with the free Wolfram Player or other Wolfram Language products.
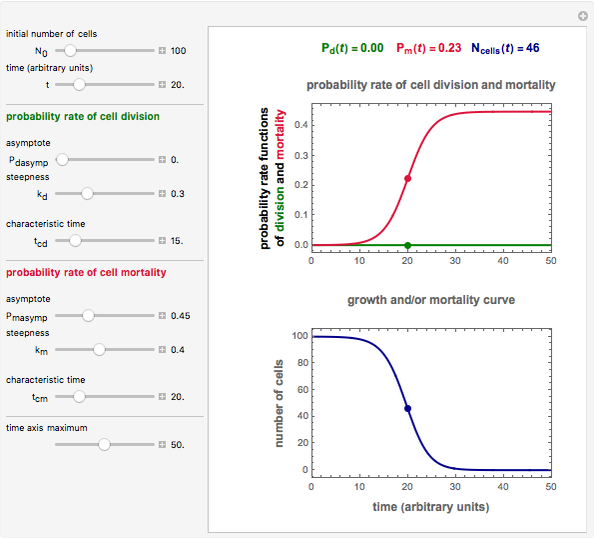
This Demonstration simulates different patterns in the evolution of microbial populations. It can describe unlimited growth, growth reaching equilibrium, growth ending in mortality, pure mortality, and mortality ending in new growth. It is based on a deterministic version of a probabilistic model originally developed for microbial cell growth, where a member of the population, after any time increment, can be in one of three states: alive but undivided, divided, or dead, with probability rates that vary with time.
Contributed by: Mark D. Normand and Micha Peleg (March 2011)
Open content licensed under CC BY-NC-SA
Snapshots

Details
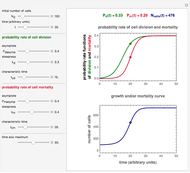
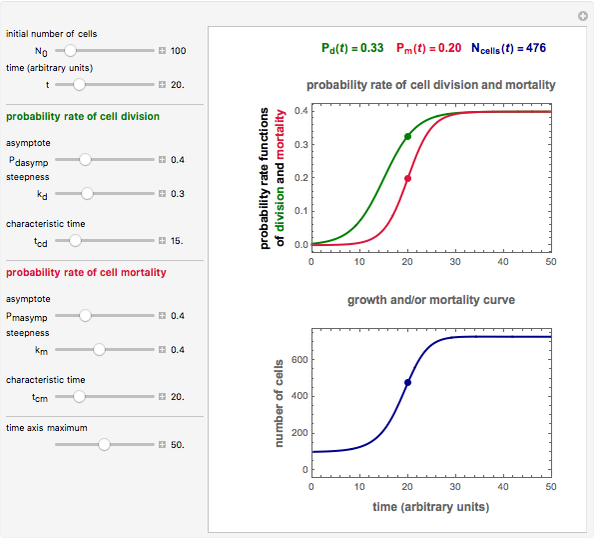
Snapshot 1: logistic ("sigmoid") growth
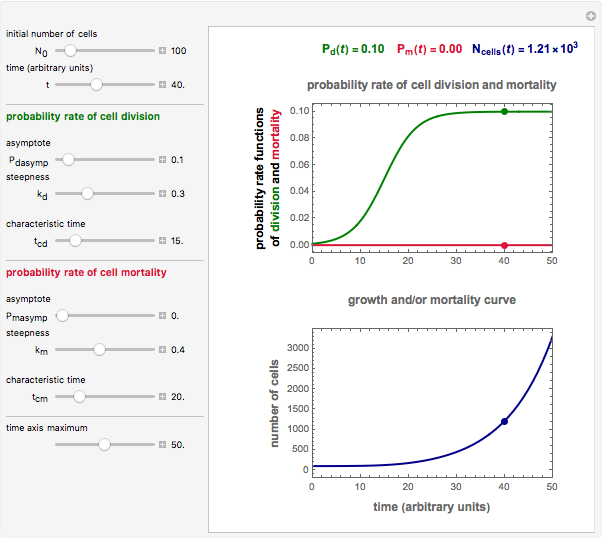
Snapshot 2: exponential growth
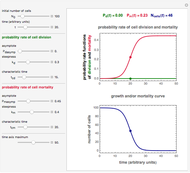
Snapshot 3: pure mortality
Snapshot 4: mortality followed by renewed growth
This Demonstration describes the evolution of a microbial population. A viable cell at time  can be in one of three states at time
  : divided with a probability of
  , dead with a probability of
  , or alive but undivided with a probability of
  , where
  and
and  are the division and mortality probability rate functions, respectively. These two functions are assumed to be logistic, that is, governed by three parameters each:
  or
or  ,
,  or
or  , and
, and  or
or  , all of which have their values entered with sliders. They represent these probability rate functions' asymptotic level, rate of ascent, and the time location of the inflection point, respectively, that is,
  and
and  . The Demonstration then calculates and plots the number of cells alive at time ,
  , descendent of the specified initial number,
  . The calculation is based on a version of the model for the limiting case where
  tends to zero, making it continuous and fully deterministic.
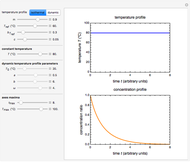
You can modify the probability rate functions to create curves depicting growth, mortality, and transitions between them. You can also enter the initial number of cells, , to calculate the number of cells at a chosen time ,  , and you can set the maximum value of the time axis in the plots. The top plot in the panel shows the chosen and functions and the bottom plot shows the corresponding growth and/or mortality curve, .
References:
J. Horowitz, M. D. Normand, M. G. Corradini, and M. Peleg, "Probabilistic Model of Microbial Cell Growth, Division and Mortality," Applied and Environmental Microbiology, 76(1), 2010 pp. 230–242.
M. G. Corradini, M. D. Normand, and M. Peleg, "A Stochastic and Deterministic Model of Microbial Heat Inactivation," Journal of Food Science, 75, 2010 pp. R59–R70.
Permanent Citation
 Ratio-Based Modified Logistic Isothermal Microbial Growth
Mark D. Normand and Micha Peleg Modified Logistic Isothermal Microbial Growth Ratio
Mark D. Normand and Micha Peleg Generalized Logistic (Verhulst) Isothermal Microbial Growth
Mark D. Normand and Micha Peleg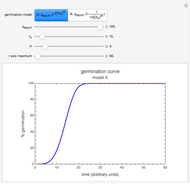 Isothermal Germination of Seeds and Microbial Spores
Mark D. Normand and Micha Peleg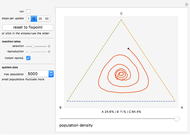 Stochastic Rock-Paper-Scissors Population Dynamics
Martin Weidl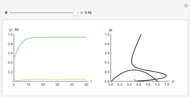 Bifurcation in a Model of Spruce Budworm Populations
Selwyn Hollis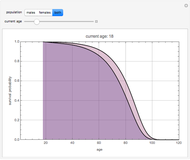 Life Expectancy in the U.S. Population
Jean Buck and Mike Pilat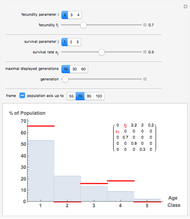 Age Distributions from a Leslie Model for Age-Structured Populations
J. Ackermann and H. Hogreve Lag Time in Microbial Growth
Mark D. Normand and Micha Peleg Modeling World Student Populations
Ronald Monson
-
 Ratkowski's Square Root Growth Rate Model for High Temperatures
Micha Peleg -
 Gordon-Taylor and Fox Equations for Glass Transition Temperature
Micha Peleg -
 Force to Overcome Vacuum Pull
Micha Peleg -
 Extending the Square Root Growth Rate Model to Lethal Low Temperatures
Micha Peleg -
 Probability of Being Strange According to Paulos
Micha Peleg -
 Successive Three-Point Method for Weibullian Chemical Degradation
Micha Peleg -
 Estimating Cohesion and Tensile Strength of Compacted Powders
Micha Peleg -
 Three-Endpoints Method for Isothermal Weibullian Chemical Degradation
Micha Peleg -
 Vitamin C Loss in Foods During Heat Processing and Storage
Micha Peleg -
 Parameterizing Temperature-Viscosity Relations
Micha Peleg -
 Laplace Distribution in Fluctuating Stock Index Records
Micha Peleg -
 Weibullian Chemical Degradation
Micha Peleg -
 Simulating Ascorbic Acid Degradation
Micha Peleg -
 Additive and Multiplicative Risks
Micha Peleg -
 Endpoints Method for Predicting Chemical Degradation in Frozen Foods
Micha Peleg -
 Exponential Model for Arrhenius Activation Energy
Micha Peleg -
 Prediction of Isothermal Degradation by the Endpoints Method
Micha Peleg -
 Risk Guesstimation from Factor Ranges
Micha Peleg -
 Volatiles Formation Kinetics in Stored Fish
Micha Peleg -
 Comparison of Six Sigmoid Growth Curve Models
Micha Peleg