Lag Time in Microbial Growth


Requires a Wolfram Notebook System
Interact on desktop, mobile and cloud with the free Wolfram Player or other Wolfram Language products.
Frequently, when a microbial population is transferred into a new habitat, noticeable cell division only commences after what is known as a "lag time". According to the food microbiology literature, this lag time can be determined by extrapolating the tangent to the growth curve at its inflection point to the line  , where
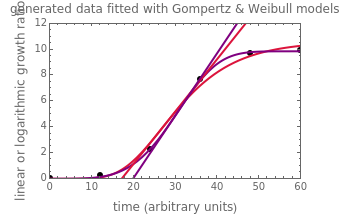
  is the inoculum's original size. In this Demonstration, simulated growth ratio data, with or without random scatter, is fitted to the Gompertz or stretched exponential (Weibullian) models using nonlinear regression. The tangent method is then used to calculate the lag time with the fitted parameters. It is shown that the lag time so calculated can depend on the growth model chosen and be substantially longer than that marking the time where growth can first be observed.
Contributed by: Mark D. Normand and Micha Peleg (September 2014)
Open content licensed under CC BY-NC-SA
Snapshots
Details
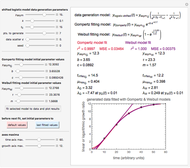
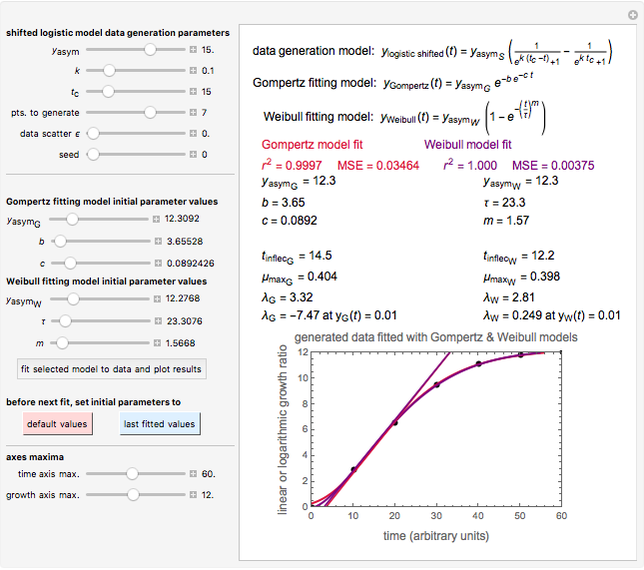
Snapshot 1: Calculated lag times when they hardly exist, if they exist at all; obtained by the tangent method.
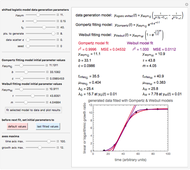
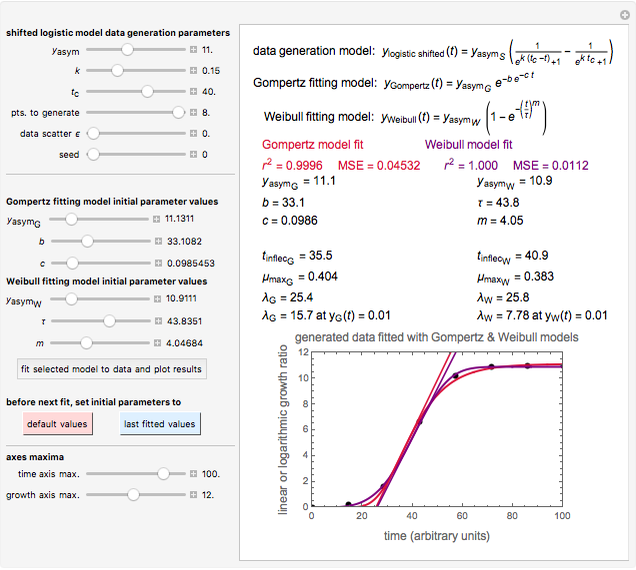
Snapshot 2: Lag times obtained by the tangent method when the Gompertz and Weibullian models closely agree. Notice the discrepancy with the time to reach normalized growth or a growth ratio of 0.01.
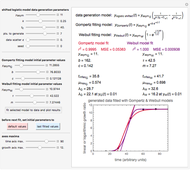
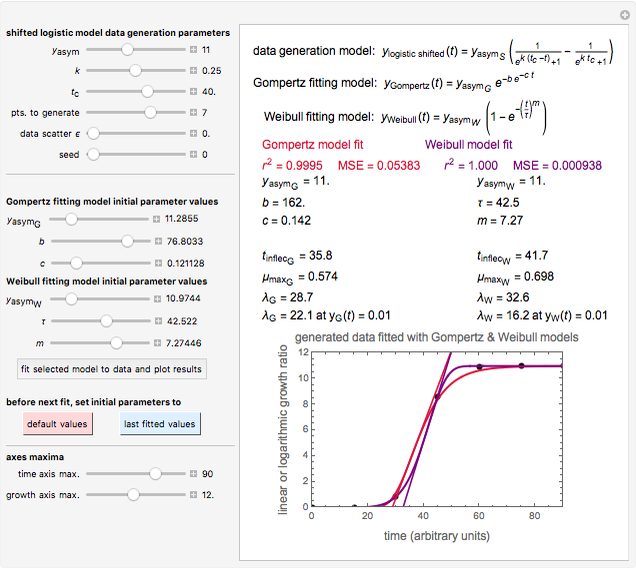
Snapshot 3: Lag times obtained by the tangent method when the Gompertz and Weibullian models do not closely agree. Notice the discrepancy with the time to reach normalized growth or a growth ratio of 0.01.
Delayed cell division in a bacterial population introduced into a new habitat is a topic of much interest and importance in food safety and microbiology in general. The "lag time", therefore, plays an important role in mathematical modeling of microbial growth. Since individual cells start and complete their division at different times, as can be observed microscopically, determination of the lag time is not a trivial issue.
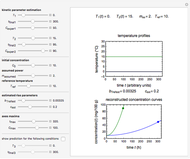
A common method is to record the growth curve, the number of living cells  at time
  , which in most cases has a sigmoid shape, find its inflection point graphically or mathematically after fitting the data with a growth model, and draw or calculate the tangent line at the inflection point. The intersection of the tangent line with the line
  , where
  is the initial number, is considered the lag time [1, 2].
A notable issue with the tangent method is that the lag time it produces can be substantially longer than the time when the rise in the number of cells can be observed [3]. Also, different growth models of comparable fit as judged by statistical criteria can render different inflection point locations and corresponding slopes. These features are demonstrated with simulated microbial growth data, with or without random scatter, using the shifted logistic equation [4] as a model. The shifted logistic model is  , where the growth parameters
  ,
,  , and
, and  are entered with sliders, as are the plot axes' maxima. The number of points to generate is also entered with a slider, as is the amplitude of the superimposed random scatter,
  . The seed slider allows differing random point scatter for
  .
.
The generated data is fitted by the Gompertz and stretched exponential (Weibulllian) models. The three model equations are displayed and below them the fit level in terms of  and MSE (mean square error). The growth curves and models are all presented in the form of
  versus
  relationships where
  or
or 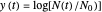 . The former is for small and moderate growth levels and the latter for extensive growth of several orders of magnitude [4]. Either way, they are consistent with the fact that at
  ,
,  .
.
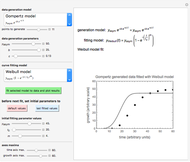
The two regression models are the Gompertz equation,  , and stretched exponential (Weibull) equation,
  . To fit the data, you can modify the default parameters’ values until the plotted gray curves roughly match the data points (hint: always start by moving the
  slider first).
Once an approximate fit is obtained, click the "fit selected model to data and plot results" button to do the regression. The resulting fitted curves' parameter values and corresponding goodness of fit  and MSE will then appear above the plot. Often the fit can be improved by using the fitted model's parameters as initial guesses for successive attempts. This is done by clicking the light blue "last fitted values" setter and again clicking the "fit selected model to data and plot results" button until the
  and MSE values remain unchanged.
Also displayed are the fit parameters for the Gompertz and Weibullian models,  ,
,  , and
, and  and
and  ,
,  , and
, and  , respectively, and the corresponding inflection points,
  and
and  , the slopes at the inflection points,
  and
and  , the lag times calculated by the tangent method,
  and
and  , and the corresponding times where
  and
and  assume the (arbitrary) value of 0.01,
  at
at  and
and  at
at  , respectively.
Notice that growth data generated with the shifted logistic equation, when fitted with the popular Gompertz model (but not the Weibullian), can render a negative lag time, which has no physical meaning. This is one of the results of the Gompertz model's mathematical structure, which implies that  but has little influence on its fit.
References
[1] M. H. Zwietering, I. Jongenburger, F. M. Rombouts, and K. van 't Riet, "Modeling of Bacterial Growth Curve," Applied and Environmental Microbiology, 56, 1990 pp. 1875–1881.
[2] I. A. M. Swinnen, K. Bernaerts, E.J.J. Dens, A.H. Geeraerd, and J. F. Van Impe, "Predictive Modelling of the Microbial Lag Phase: a Review," International Journal of Food Microbiology, 94, 2004 pp. 137–159.
[3] M. Peleg and M. G. Corradini, "Microbial Growth Curves - What the Models Tell Us and What They Cannot," CRC Critical Reviews in Food Science, 51, 2011 pp. 917–945.
[4] M. Peleg, Advanced Quantitative Microbiology for Foods and Biosystems: Models for Predicting Growth and Inactivation, Boca Raton, FL: CRC Press, 2006.
Permanent Citation
 Square Root Model for Rates of Microbial Growth or Inactivation
Mark D. Normand and Micha Peleg Estimation of Time to Excessive Microbial Count
Mark D. Normand and Micha Peleg Sigmoid Microbial Survival Curves
Mark D. Normand and Micha Peleg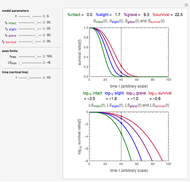 Degrees of Microbial Injury and Survival
Mark D. Normand and Micha Peleg Chaos in Tumor Growth Model with Time-Delayed Immune Response
Clay Gruesbeck Chaos Induced by Delay in Model of the Immune Response
Clay Gruesbeck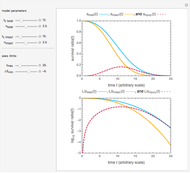 Injury in Microbial Inactivation
Mark D. Normand and Micha Peleg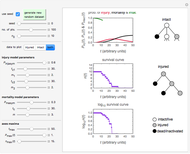 Stochastic Model of Microbial Injury and Mortality
Mark D. Normand , Maria G. Corradini, and Micha Peleg Extracting Microbial Inactivation Parameters from Final Isothermal Survival Ratios
Mark D. Normand and Micha Peleg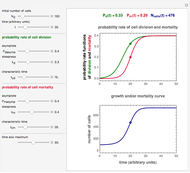 Microbial Population Growth, Mortality, and Transitions between Them
Mark D. Normand and Micha Peleg
-
 Ratkowski's Square Root Growth Rate Model for High Temperatures
Micha Peleg -
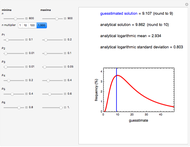
 Gordon-Taylor and Fox Equations for Glass Transition Temperature
Micha Peleg -
 Force to Overcome Vacuum Pull
Micha Peleg -
 Extending the Square Root Growth Rate Model to Lethal Low Temperatures
Micha Peleg -
 Probability of Being Strange According to Paulos
Micha Peleg -
 Successive Three-Point Method for Weibullian Chemical Degradation
Micha Peleg -
 Estimating Cohesion and Tensile Strength of Compacted Powders
Micha Peleg -
 Three-Endpoints Method for Isothermal Weibullian Chemical Degradation
Micha Peleg -
 Vitamin C Loss in Foods During Heat Processing and Storage
Micha Peleg -
 Parameterizing Temperature-Viscosity Relations
Micha Peleg -
 Laplace Distribution in Fluctuating Stock Index Records
Micha Peleg -
 Weibullian Chemical Degradation
Micha Peleg -
 Simulating Ascorbic Acid Degradation
Micha Peleg -
 Additive and Multiplicative Risks
Micha Peleg -
 Endpoints Method for Predicting Chemical Degradation in Frozen Foods
Micha Peleg -
 Exponential Model for Arrhenius Activation Energy
Micha Peleg -
 Prediction of Isothermal Degradation by the Endpoints Method
Micha Peleg -
 Risk Guesstimation from Factor Ranges
Micha Peleg -
 Volatiles Formation Kinetics in Stored Fish
Micha Peleg -
 Comparison of Six Sigmoid Growth Curve Models
Micha Peleg