Relaxation of a Maxwell Element

Requires a Wolfram Notebook System
Interact on desktop, mobile and cloud with the free Wolfram Player or other Wolfram Language products.
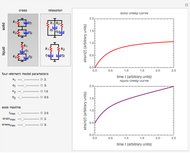
This Demonstration aids in visualization of the roles of the two components of a Maxwell element in its response to a unit step stress. It depicts the relaxation curve resulting from changes in the relative magnitudes of the elastic component's modulus (represented by a spring) and the dissipating component's viscosity (represented by a dashpot). It also displays the element's relaxation time  and the ratio between
  and the characteristic observation time (represented by the plot's time scale) referred to here as the Deborah number
  .
.
Contributed by: Mark D. Normand and Micha Peleg (March 2011)
Open content licensed under CC BY-NC-SA
Snapshots
Details
Snapshot 1: a relaxation curve with a short relaxation time  and small Deborah number
Snapshot 2: a relaxation curve with a longer relaxation time  and larger Deborah number
Snapshot 3: a relaxation curve with a still longer relaxation time  and even larger Deborah number
Snapshot 4: apparent elastic response of an element with a very long relaxation time 
Snapshot 5: apparent viscous response of an element with a very short relaxation time 
This Demonstration calculates and plots the stress relaxation curve of a Maxwell element subjected to a unit step stress described by the equation  where
where  is the dissipating stress at time
  ,
,  is the elastic component's modulus and
  the viscosity. The element's relaxation time,
  , is the ratio
  , here with arbitrary time units. The Deborah number,
  , is represented here by the ratio
  , where
  is the maximum value of the plot's time axis. The values of the parameters
  ,
,  , and
, and  are entered with sliders. An ideogram of the Maxwell element (a spring-dashpot in series combination) is displayed above the plot. Also shown are the stress relaxation equation and the current calculated numeric values of
  and
and  .
.
Permanent Citation


