Distributions of Continuous Order Statistics

Requires a Wolfram Notebook System
Interact on desktop, mobile and cloud with the free Wolfram Player or other Wolfram Language products.
Let  , ...,
  be a random sample from a continuous distribution. Reorder the sample in increasing order; denote the corresponding variables by
  , ...,
  . Thus, for example, is the smallest of the
  variables,
  the second smallest, and the largest. The variable
  is called the
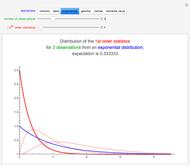
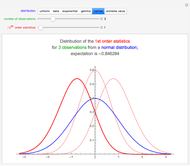
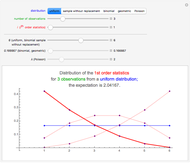
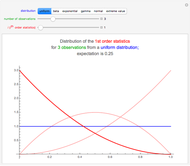
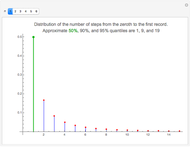
  order statistic. The Demonstration shows the probabilities of the order statistics (the red curves) when the sample is from a uniform, beta, exponential, gamma, normal, or extreme value distribution (the probability density function of is shown in blue).
Contributed by: Heikki Ruskeepää (May 2014)
Open content licensed under CC BY-NC-SA
Snapshots


Details
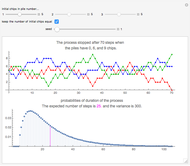
Snapshot 1: The data has the uniform distribution in the interval  ; see the blue curve. The smallest, middle, and largest result are, with high probability, in the intervals, say,
  ,
,  , and
, and , respectively. The expectations of the smallest, middle, and largest result are 0.25, 0.5, and 0.75, respectively.
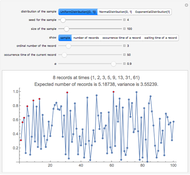
Snapshot 2: The data has the exponential distribution with expectation 1; see the blue curve. The smallest, middle, and largest result are, with high probability, at most, say, 1, 2, and 4, respectively. The expectations of the smallest, middle, and largest result are 0.33, 0.83, and 1.83, respectively.
Snapshot 3: The data has the standard normal distribution with expectation 0 and standard deviation 1; see the blue curve. The smallest, middle, and largest result are, with high probability, in the intervals, say,  ,
,  , and
, and  , respectively. The expectations of the smallest, middle, and largest result are -0.85, 0.0, and 0.85, respectively.
The other three distributions considered in this Demonstration are the beta distribution with parameters 3 and 2, the gamma distribution with parameters 3 and 2, and the extreme value distribution with parameters 0 and 2.
Let the probability density function and the cumulative distribution function of the data variable be  and
and  , respectively. The probability density function of the order statistics is then [1, p. 10]
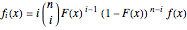 .
.
The expectations of the order statistics are calculated in the traditional way, by integrating the product of  and the density function.
The order statistics for several continuous distributions are considered in [1, Chapter 4].
Reference
[1] B. C. Arnold, N. Balakrishnan, and H. N. Nagaraja, A First Course in Order Statistics, Philadelphia: SIAM, 2008.
Permanent Citation
 Distributions of Discrete Order Statistics
Heikki Ruskeepää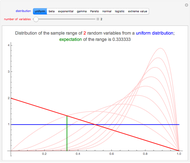 Distribution of the Sample Range of Continuous Random Variables
Heikki Ruskeepää Distribution of Records
Heikki Ruskeepää Distribution of the Sample Range of Discrete Random Variables
Heikki Ruskeepää Maximum Likelihood Estimation of Ordinary and Finite Mixture Distributions
Heikki Ruskeepää and M. A. Ghorbani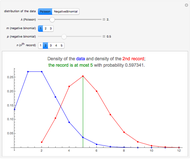 Distribution of Discrete Records
Heikki Ruskeepää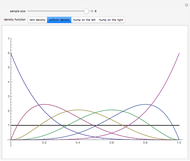 Distributions of Order Statistics
Chris Boucher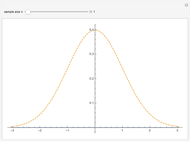 Central Limit Theorem for the Continuous Uniform Distribution
David K. Watson Estimating a Distribution Function Subject to a Stochastic Order Restriction
Michail Bozoudis and Vasileios Papachatzis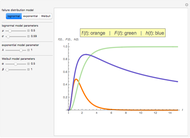 Reliability Distributions
Joe O'Hara
-
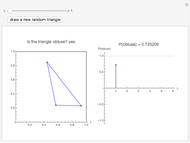 Obtuse Random Triangles from Three Points in a Rectangle
Heikki Ruskeepää -
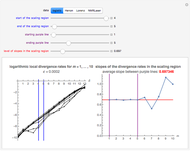 Chaotic Data: Maximal Lyapunov Exponent
Heikki Ruskeepää -
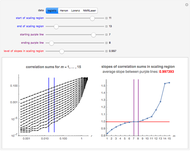 Chaotic Data: Correlation Dimension
Heikki Ruskeepää -
 Chaotic Data: Delay Time and Embedding Dimension
Heikki Ruskeepää -
 Method of Support Vector Regression
Heikki Ruskeepää -
 Local Regression for Country Data
Heikki Ruskeepää -
Distribution of the Sample Range of Continuous Random Variables
Heikki Ruskeepää -
Distribution of the Sample Range of Discrete Random Variables
Heikki Ruskeepää -
Distributions of Discrete Order Statistics
Heikki Ruskeepää -
 Distributions of Continuous Order Statistics
Heikki Ruskeepää -
 Waiting for the Next Record
Heikki Ruskeepää -
Distribution of Discrete Records
Heikki Ruskeepää -
 Records in Sequences of Random Variables
Heikki Ruskeepää -
Distribution of Records
Heikki Ruskeepää -
 The Three-Tower Problem
Heikki Ruskeepää -
 Walking Randomly Until No Shoes Are Available
Heikki Ruskeepää -
 A Reluctant Random Walk
Heikki Ruskeepää -
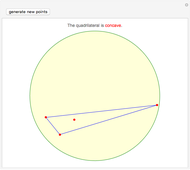 Concave Random Quadrilaterals from Four Points in a Disk
Heikki Ruskeepää -
 Obtuse Random Triangles from Three Parts of the Unit Interval
Heikki Ruskeepää -
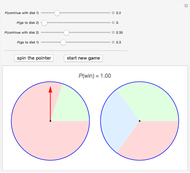 Spin Game
Heikki Ruskeepää