State Population Growth

Requires a Wolfram Notebook System
Interact on desktop, mobile and cloud with the free Wolfram Player or other Wolfram Language products.
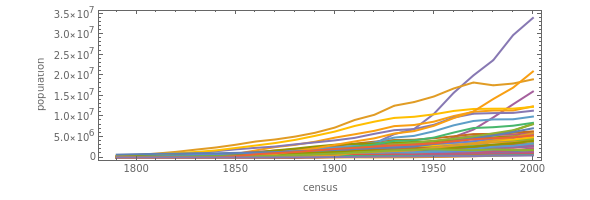
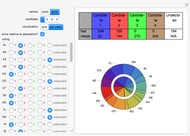
This Demonstration shows the growth in the population of the states of the United States from 1790, the year of the first decennial census required by the United States Constitution, to 2000, the year of the last decennial census. You choose the desired visualization function, the census with which the dataset should begin, and the number of years the data should span. You can also select the states that will be displayed. You can reset the displayed states to all or none. A tooltip shows the state to which each line corresponds.
Contributed by: Seth J. Chandler (March 2011)
Open content licensed under CC BY-NC-SA
Snapshots
Details
The data used in this Demonstration derives from tables published by the United States Census Bureau in PDF format and is available at http://www.census.gov/population/censusdata/table-16.pdf. The data was converted from PDF into XML using third party software and then imported into Mathematica. The data was then manipulated to the desired format.
Some of the "states" listed in this Demonstration were not "states" at the time the census was taken. The census bureau's decision to nonetheless keep the data has been retained here.
Permanent Citation
"State Population Growth"
http://demonstrations.wolfram.com/StatePopulationGrowth/
Wolfram Demonstrations Project
Published: March 7 2011
