Spectral Measures


Requires a Wolfram Notebook System
Interact on desktop, mobile and cloud with the free Wolfram Player or other Wolfram Language products.
Analyses of investments, insurance, and economic policies often depend on an ability to collapse a large set of probability-weighted outcomes to just a few numbers. Examples of this process are computations of "expected utility", (or its cousin, "certainty equivalent wealth"), means and standard deviations of the outcomes, and "value at risk". Each of these measures has strengths as well as deficiencies, the latter including frequent difficulty in coping with negative outcomes in expected utility theory, the theoretical nonexistence of standard deviations for outcomes drawn from certain distributions, and the lack of sensitivity of value at risk to the magnitude of the worst outcomes.
[more]


Contributed by: Seth J. Chandler and Roger J. Brown (October 2010)
Open content licensed under CC BY-NC-SA
Snapshots


Details
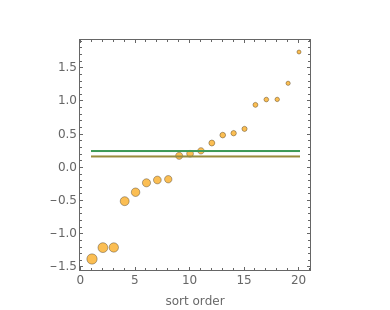
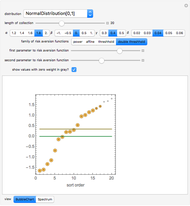
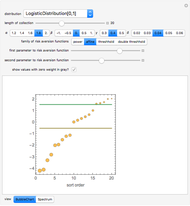
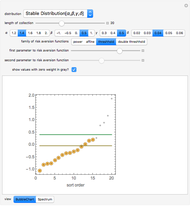
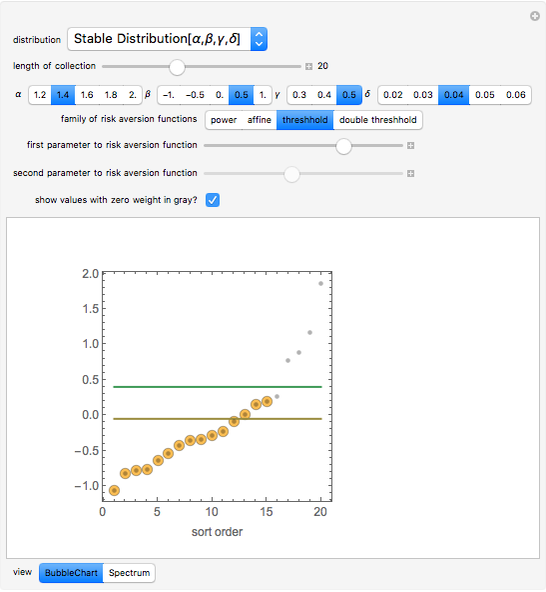
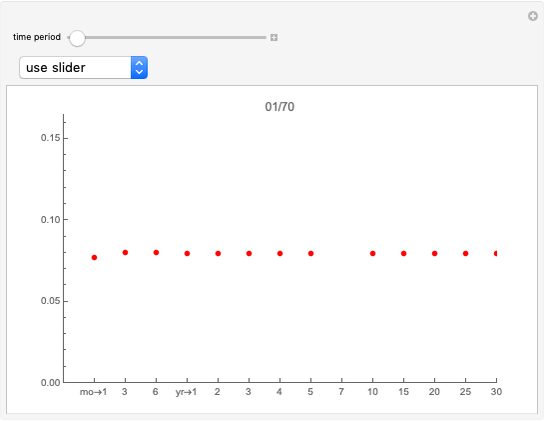
The "threshold" family of spectra has only two values: a constant value up to some position in the spectrum and zero thereafter. The risk measure "expected shortfall", which is growing in popularity and is also known as "conditional value at risk (cvar)", can be generated using a member from this family.
Pioneering work by Carlo Acerbi has been done in the field. A brief discussion of spectral measures may be found at Spectral risk measure.
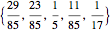
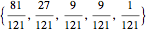
The set of permissible spectral weights is the set of nonincreasing probability density functions (sometimes also known as probability mass functions for discrete distributions).
Permanent Citation
 Estimating Insurance Premiums Using Exceedance Data and the Method of Moments
Seth J. Chandler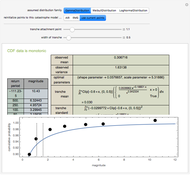 Estimating Loss Functions Using Exceedance Data and the Method of Moments
Seth J. Chandler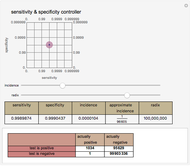 Sensitivity, Specificity, and Incidence
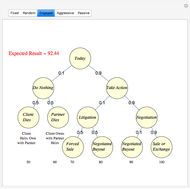
Seth J. Chandler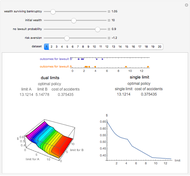 The Efficient Dual-Limit Liability Insurance Contract
Seth J. Chandler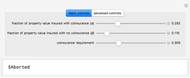 Property Coinsurance
Seth J. Chandler Efficient Single Limit Liability Insurance
Seth J. Chandler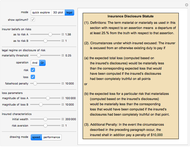 Insurance Disclosures
Seth J. Chandler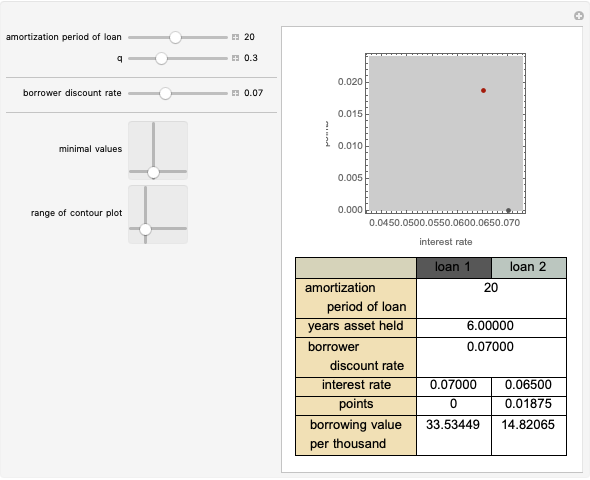 Pay the Points?
Seth J. Chandler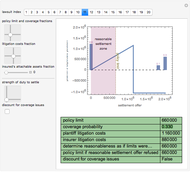 The Duty to Settle
Seth J. Chandler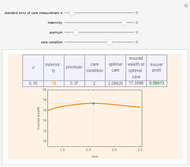 Moral Hazard
Seth J. Chandler
-
 Dissolving Partnerships
Roger J. Brown -
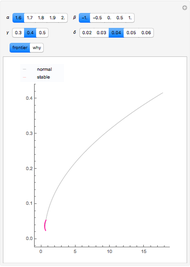 Forming the Efficient Frontier When Returns Are Non-Normal
Roger J. Brown -
 Spectral Measures
Roger J. Brown -
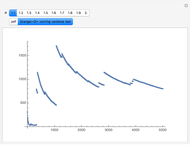 Granger-Orr Running Variance Test
Roger J. Brown -
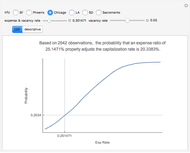 Capitalization Rate Probability
Roger J. Brown -
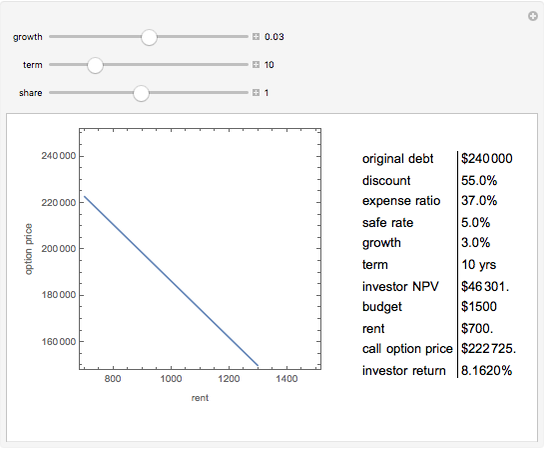
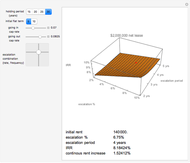 Net Lease Economics
Roger J. Brown -
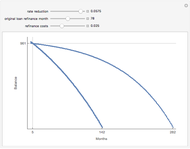 The Refinance Decision
Roger J. Brown -
 True Cost of Variable Rate Mortgage Funds
Roger J. Brown -
 Term Structure of Interest Rates
Roger J. Brown -
 Generalized Central Limit Theorem
Roger J. Brown -
 Inflation-Adjusted Yield
Roger J. Brown -
 Simulating the IRR
Roger J. Brown -
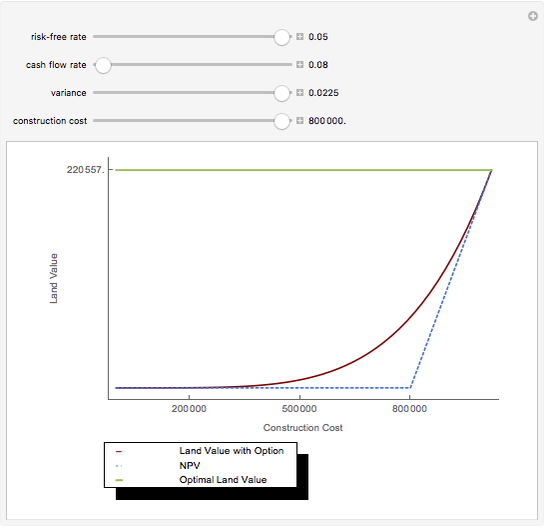 Real Options
Roger J. Brown -
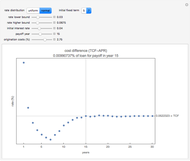
 The Price-Terms Tradeoff
Roger J. Brown -
 Fitting an Elephant
Roger J. Brown -
 Solving the Subprime Loan Problem
Roger J. Brown -
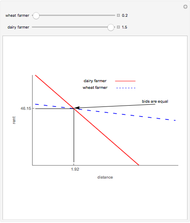 Why Location Matters: The Bid Rent Curve
Roger J. Brown -
 Explaining Real Estate Price Bubbles
Roger J. Brown -
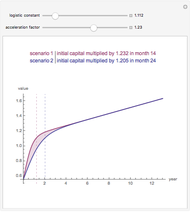 Value Added Growth Model
Roger J. Brown -
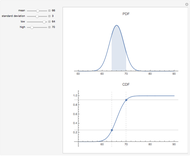 Connecting the CDF and the PDF
Roger J. Brown