Elasticity Function


Requires a Wolfram Notebook System
Interact on desktop, mobile and cloud with the free Wolfram Player or other Wolfram Language products.
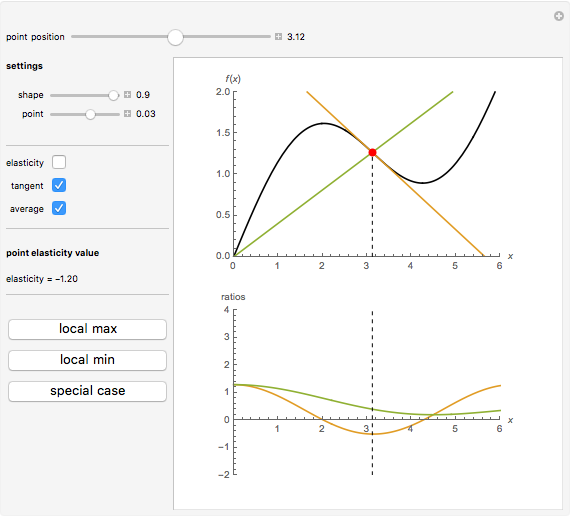
This Demonstration considers elasticity, which is one of the central concepts in theoretical and empirical economics. Elasticity is indispensable because it shows relative (per cent) change of a given variable due to relative (per cent) change in another variable. We use a smooth non-negative function  to demonstrate some useful properties of elasticity analysis. Visualization of different ratios, which are usually treated analytically, can be instructive for better understanding of elasticity and related economic concepts—for example, elasticity of demand function.

Contributed by: Timur Gareev (January 2018)
Open content licensed under CC BY-NC-SA
Snapshots
Details
Elasticity is a function  that can be built from an arbitrary function
  . Elasticity at a certain point is usually calculated as
 .
.
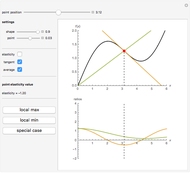
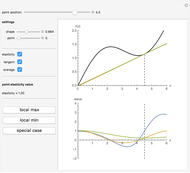
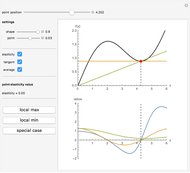
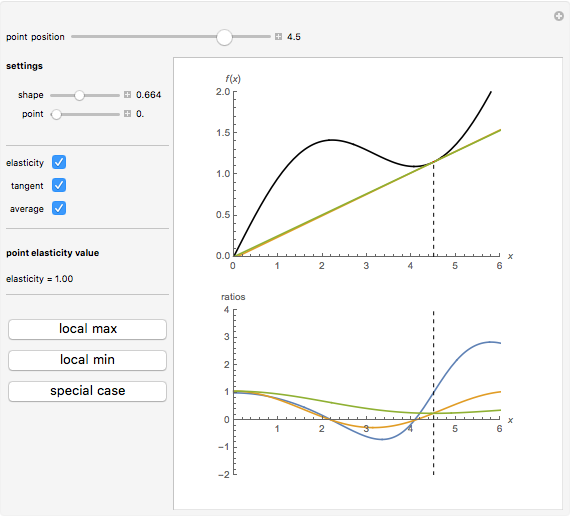
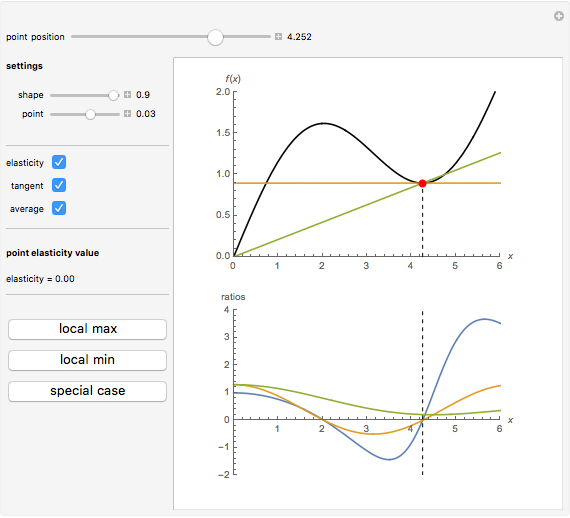
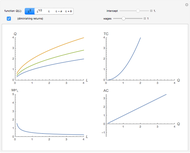
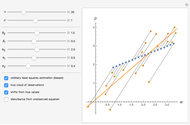
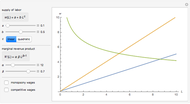
We have chosen , as it has two inflection points (local minimum and local maximum), and also sections that slope up and down. As long as we have four terms on the right-hand side of the above expression, elasticity can be expressed in many forms. One interesting form, from an economic viewpoint, is the ratio of slopes of tangent and average curves that are shown on the upper plot:
 .
.
The bottom plot reflects all three functions: average  , tangent
  and elasticity itself for a given . For each , the elasticity function defines elasticity values for each point of
  . Notice that the average line in our example is always non-negative. At inflection points the tangent is zero, as is the elasticity. Elasticity is negative for the downward-sloping section of .
Permanent Citation
 The Price Elasticity of Demand
Sarah Lichtblau Cobb-Douglas Utility Function
Francisco José Espinosa Optimization of Cobb-Douglas Function
Amir Ahmadi and Tom Creahan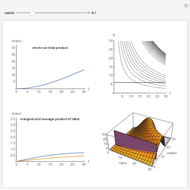 An Example of a Production Function
Javier Puértolas Revenue and Costs Curves Analysis
Timur Gareev The Backward-Bending Supply Function in Fisheries
Arne Eide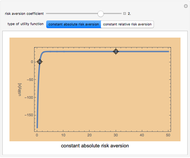 Constant Risk Aversion Utility Functions
Seth J. Chandler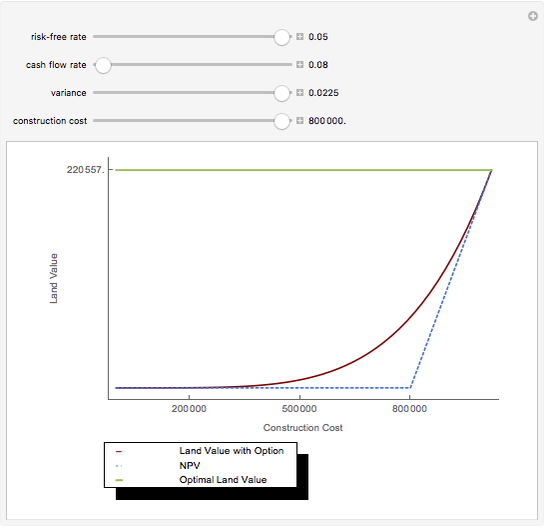 Real Options
Roger J. Brown Monopoly Model
David Youngberg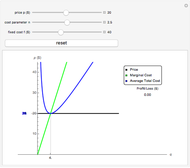 Competitive Model
David Youngberg
-
 Returns to Scale in One-Factor Production Functions
Timur Gareev -
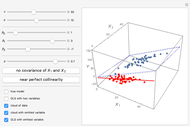 Omitted Variable Bias in 3D
Timur Gareev -
Revenue and Costs Curves Analysis
Timur Gareev -
 Leontief Production Function
Timur Gareev -
 Simultaneity Bias
Timur Gareev -
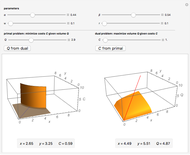 Firm Costs Optimization Problem in Primal and Dual Form
Timur Gareev -
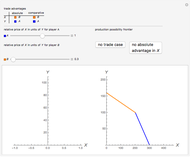 Comparative and Absolute Advantage
Timur Gareev -
 Firm with Two Plants
Timur Gareev -
 Elasticity Function
Timur Gareev -
 Substitute and Complementary Goods
Timur Gareev -
 Monopoly with Two Plants
Timur Gareev -
 Best Response in Static Two-Player Games
Timur Gareev -
 Hotelling Model of Product Quality Differentiation
Timur Gareev -
 Endogeneity Bias
Timur Gareev -
 Discriminating Monopolist with Two Independent Markets
Timur Gareev -
 Monopsony in the Labor Market
Timur Gareev -
 Nondiscriminating Monopolist with Two Independent Markets
Timur Gareev -
 Supply Curve from Piecewise Linear Cost Function
Timur Gareev -
 Duopoly Model in 3D
Timur Gareev -
 Isocosts, Isoquants, Isocline Lines, and Scale Lines for Homogeneous (Cobb-Douglas) Functions
Timur Gareev