Omitted Variable Bias in 3D


Requires a Wolfram Notebook System
Interact on desktop, mobile and cloud with the free Wolfram Player or other Wolfram Language products.
This Demonstration develops geometric intuition behind the concept of omitted variable bias. In econometrics modeling, there is a persistent risk of omitting an important variable (i.e. due to not understanding the true model structure or due to a lack of relevant data). As a result, endogeneity [1] spoils the model, resulting in inconsistent and therefore misleading estimations of model coefficients. Usually the effect of the omitted variable is explained analytically or via numerical examples, but visualization may bring more insight to the issue.
[more]
Contributed by: Timur Gareev (May 2018)
Open content licensed under CC BY-NC-SA
Snapshots


Details
If we try to estimate a true model of the form

with an incorrect model of the form
 ,
,
the estimation of  , which is signed
  , is most likely biased. Indeed, we have by definition:
 .
.
Here we have
 ;
;

and
 .
.
The element  is an error term vector, where each observation term is independent (from each other) and normally distributed with mean 0 and variance
  .
.
The key term in the preceding expression is  , which we can simulate with the
  control. If it equals zero, no problems arise—estimations are unbiased,
  . However, in practice the important feature of the model of the form
is that  , and so omitting
  from the evaluation causes bias. It is always a source of confusion, but should not be too high, otherwise results even without omitted variables will be misleading (as we approach the other "trap" in the form of multicollinearity).
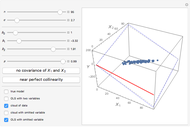
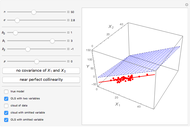
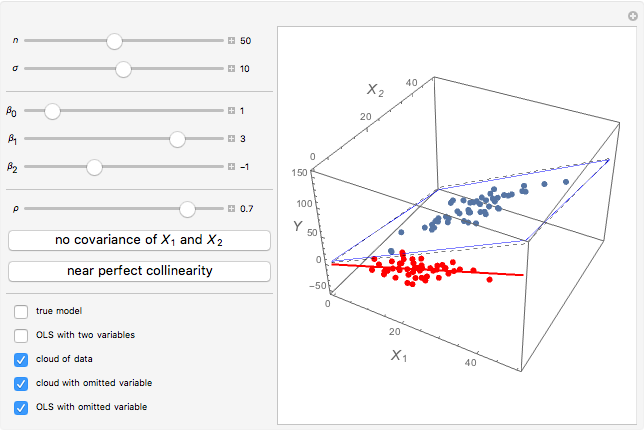
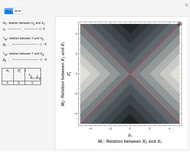
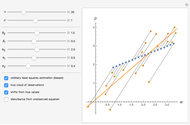
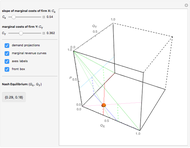
We demonstrate it as follows. The blue cloud is the observations cloud, and each point stands for one observation (the number of observations may be changed with  ). The black lattice shows the true model. The blue lattice reflects the correct estimation with both variables
  and included. The red line is the regression with the omitted variable. (The red cloud is the projection of the observations cloud from true 3D space to 2D.) Use the checkboxes to switch the appearance of elements on and off. When you use the checkboxes, the cloud does not change. Be warned, though, that each time parameters change, the cloud of observation changes as well.
Most important are the slopes of black and blue planes and the red line. When the slopes are relatively equal, there is no bias.
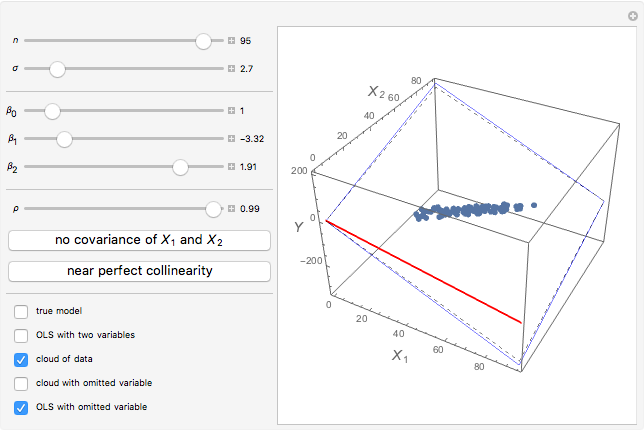
Increasing and reducing  may considerably reduce bias. Use the buttons to study special cases with
  or
or  (
( corresponds to perfect multicollinearity, so we cannot study this case). It is also recommended to check
  visually.
Reference
[1] Wikipedia. "Endogeneity (Econometrics)." (May 7, 2018) en.wikipedia.org/wiki/Endogeneity_(econometrics).
Permanent Citation
 Omitted Variable Bias
Alrik Thiem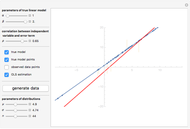 Endogeneity Bias
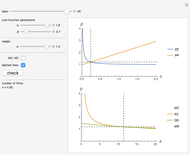
Timur Gareev Variance-Bias Tradeoff
Ian McLeod Symmetrizing Positive Random Variables
Ian McLeod Entropy of a Message Using Random Variables
Daniel de Souza Carvalho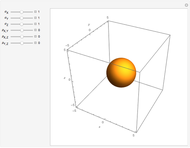 Joint Density of Trivariate Gaussian Random Variables
John M. Shea Joint Density of Bivariate Gaussian Random Variables
John M. Shea Distribution of the Sample Range of Continuous Random Variables
Heikki Ruskeepää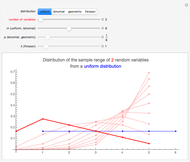 Distribution of the Sample Range of Discrete Random Variables
Heikki Ruskeepää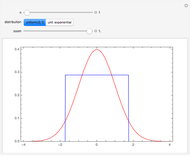 Illustrating the Central Limit Theorem with Sums of Uniform and Exponential Random Variables
Ian McLeod
-
 Krugman's Model of Increasing Returns and Monopolistic Competition
Timur Gareev -
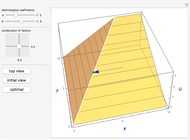
 Returns to Scale in One-Factor Production Functions
Timur Gareev -
 Omitted Variable Bias in 3D
Timur Gareev -
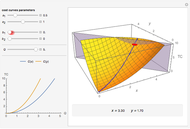
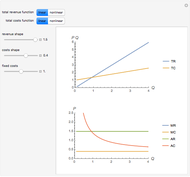 Revenue and Costs Curves Analysis
Timur Gareev -
 Leontief Production Function
Timur Gareev -
 Simultaneity Bias
Timur Gareev -
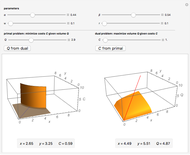 Firm Costs Optimization Problem in Primal and Dual Form
Timur Gareev -
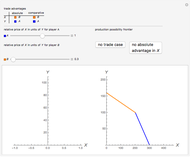 Comparative and Absolute Advantage
Timur Gareev -
 Firm with Two Plants
Timur Gareev -
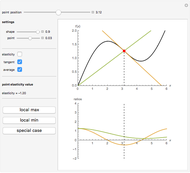 Elasticity Function
Timur Gareev -
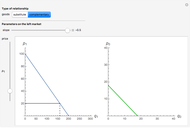 Substitute and Complementary Goods
Timur Gareev -
 Monopoly with Two Plants
Timur Gareev -
 Best Response in Static Two-Player Games
Timur Gareev -
 Hotelling Model of Product Quality Differentiation
Timur Gareev -
Endogeneity Bias
Timur Gareev -
 Discriminating Monopolist with Two Independent Markets
Timur Gareev -
 Monopsony in the Labor Market
Timur Gareev -
 Nondiscriminating Monopolist with Two Independent Markets
Timur Gareev -
 Supply Curve from Piecewise Linear Cost Function
Timur Gareev -
 Duopoly Model in 3D
Timur Gareev