Synergism and Antagonism


Requires a Wolfram Notebook System
Interact on desktop, mobile and cloud with the free Wolfram Player or other Wolfram Language products.
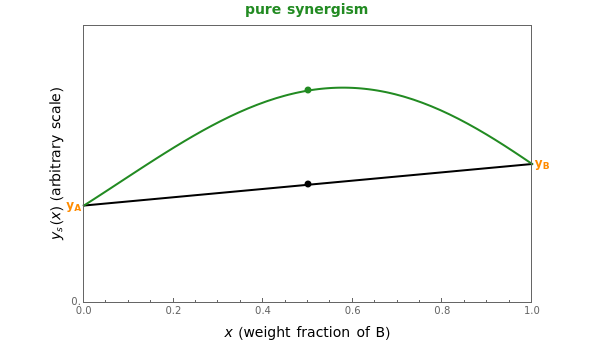
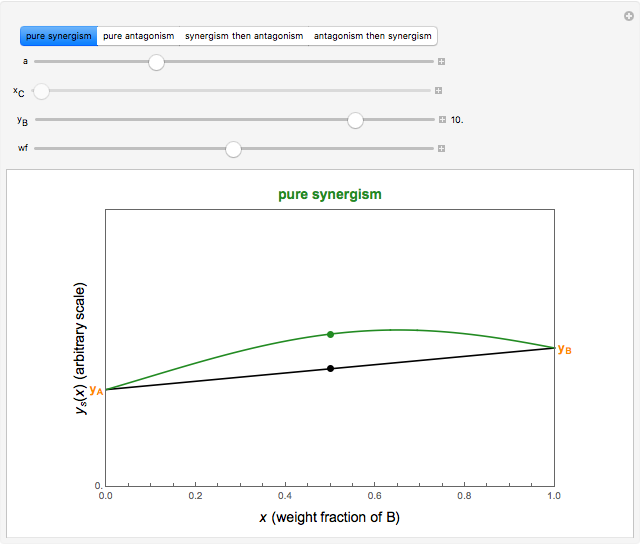
This Demonstration provides visualization of the synergism and antagonism phenomena encountered in the simultaneous application of two antimicrobial agents, drugs, or other biologically active compounds. In synergism, the combined effect is greater than that calculated from the sum of the individual effects, and in antagonism it is smaller. The merely additive effect, due to stoichiometry, is the straight black line connecting the activity of compound A alone with that of compound B alone on the plot of the combined activity versus the mixture's composition. Synergism manifests in a curve, or local part of a curve, lying above this line, and antagonism is below it. The curves generated are schematic and intended solely for illustration; there are four kinds: pure synergism, pure antagonism, synergism turning into antagonism, and antagonism turning into synergism.
Contributed by: Mark D. Normand and Micha Peleg (October 2011)
Open content licensed under CC BY-NC-SA
Snapshots


Details
Snapshot 1: purely additive effect (no synergism or antagonism)
Snapshot 2: pure mild synergism
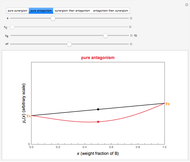
Snapshot 3: pure mild antagonism
Snapshot 4: pure strong antagonism
Snapshot 5: synergism changing into antagonism
Snapshot 6: antagonism changing into synergism
This Demonstration illustrates graphically the phenomena of synergism and antagonism in hypothetical binary mixtures of two biologically active compounds, A and B. You can generate four principal scenarios by clicking the setter bar. The scenarios are: pure synergism, pure antagonism, synergism turning into antagonism by the rise of compound B's weight fraction  , and antagonism turning into synergism. The range of is from zero (signifying 100% A and 0% B), to one (signifying 0% A and 100% B). What is plotted is an arbitrary curve depicting the mixture's activity or efficacy
  on an arbitrary scale, as a function of .
The activity or efficacy of component A alone is  and that of component B alone is
  . Each can be made smaller, greater than, or equal to the other by moving the slider. A point on the black line that connects and , chosen by moving the "wf" slider, represents a mixture whose effect is merely additive, that is, could be predicted from stoichiometry alone. A curve of pure synergism is above this line for any
  and a curve of pure antagonism in this range is below it. The intensity of either is represented by the deviation from the straight line between and in either direction, and can be increased or decreased by moving the "a" slider.
A transition from synergism to antagonism, or vice versa, is controlled by  , the point where intersects the straight line connecting and , and its location can also be varied by a slider.
The sole purpose of the Demonstration is to provide qualitative images of how the phenomena of synergism and antagonism in binary mixtures are manifested in the general shape of the versus relationship. Consequently, we have chosen models of convenience to generate the plots, whose ordinate has arbitrary scale. The same is true for the models' parameters and their ranges. As a result, the vs. plots do not necessarily match any actual biological system.
Although only bioactive materials are mentioned, the Demonstration can also be used to illustrate synergism and antagonism where the effect is physical, as in hydrocolloid interactions that affect their solutions' viscosity [1], or chemical, as when an antioxidant turns into an oxidant or vice versa.
Reference
[1] G. Kaletunc-Gencer and M. Peleg, "Rheological Characteristics of Selected Food Gum Mixtures in Solution," Journal of Texture Studies, 17, 1986 pp. 61–70.
Permanent Citation
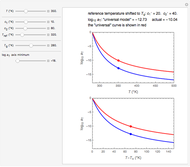 Williams, Landel, and Ferry Equation Compared with Actual and "Universal" Constants
Mark D. Normand and Micha Peleg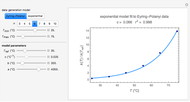 Eyring-Polanyi versus Exponential Model for Chemical Reactions
Mark D. Normand, Christina S. Barsa, and Micha Peleg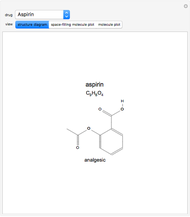 26 Commonly Used Drugs
Enrique Zeleny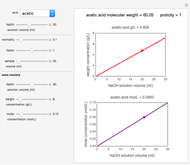 Titration of Common Food Acids
Amy D. Kim, Mark D. Normand, and Micha Peleg Volatiles Formation Kinetics in Stored Fish
Mark D. Normand and Micha Peleg Fit of First-Order Kinetic Model in Degradation Processes
Mark D. Normand and Micha Peleg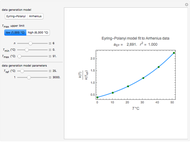 Arrhenius versus Eyring-Polanyi Model
Mark D. Normand and Micha Peleg Vitamin C Loss in Foods During Heat Processing and Storage
Mark D. Normand and Micha Peleg Simulating Ascorbic Acid Degradation
Mark D. Normand and Micha Peleg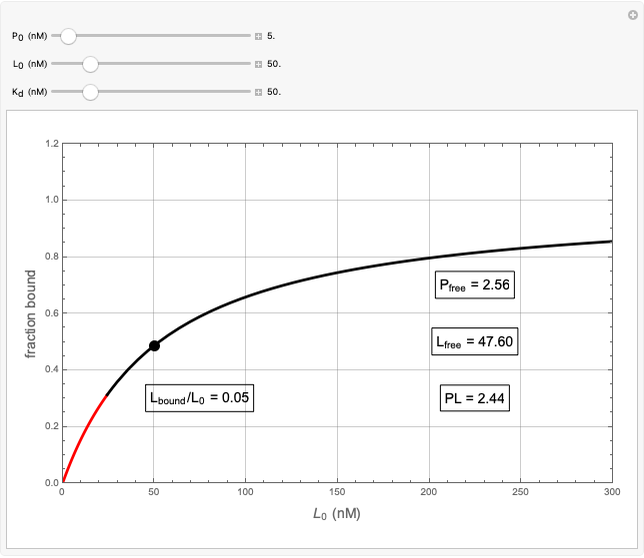 Saturation Binding of Ligands to Proteins
Karl Volz
-
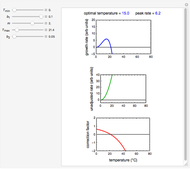 Ratkowski's Square Root Growth Rate Model for High Temperatures
Micha Peleg -
 Gordon-Taylor and Fox Equations for Glass Transition Temperature
Micha Peleg -
 Force to Overcome Vacuum Pull
Micha Peleg -
 Extending the Square Root Growth Rate Model to Lethal Low Temperatures
Micha Peleg -
 Probability of Being Strange According to Paulos
Micha Peleg -
 Successive Three-Point Method for Weibullian Chemical Degradation
Micha Peleg -
 Estimating Cohesion and Tensile Strength of Compacted Powders
Micha Peleg -
 Three-Endpoints Method for Isothermal Weibullian Chemical Degradation
Micha Peleg -
Vitamin C Loss in Foods During Heat Processing and Storage
Micha Peleg -
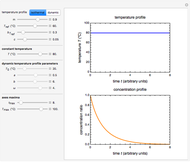
 Parameterizing Temperature-Viscosity Relations
Micha Peleg -
 Laplace Distribution in Fluctuating Stock Index Records
Micha Peleg -
 Weibullian Chemical Degradation
Micha Peleg -
Simulating Ascorbic Acid Degradation
Micha Peleg -
 Additive and Multiplicative Risks
Micha Peleg -
 Endpoints Method for Predicting Chemical Degradation in Frozen Foods
Micha Peleg -
 Exponential Model for Arrhenius Activation Energy
Micha Peleg -
 Prediction of Isothermal Degradation by the Endpoints Method
Micha Peleg -
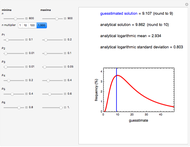 Risk Guesstimation from Factor Ranges
Micha Peleg -
Volatiles Formation Kinetics in Stored Fish
Micha Peleg -
 Comparison of Six Sigmoid Growth Curve Models
Micha Peleg