Correlated Binary Decision Rules

Requires a Wolfram Notebook System
Interact on desktop, mobile and cloud with the free Wolfram Player or other Wolfram Language products.
There are  rules mapping a set of
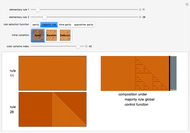
  factors onto a binary outcome. This Demonstration shows how a set of rules can be generated in which the mappings are correlated with each other. This process is useful in generating, among other things, synthetic parameterized judiciaries, which can be compared to real-world judicial bodies.
Contributed by: Seth J. Chandler (March 2011)
Open content licensed under CC BY-NC-SA
Snapshots
Details
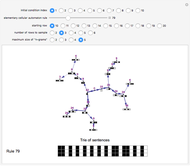
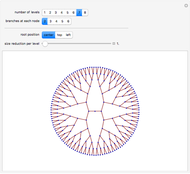
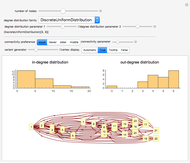
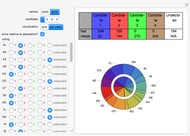
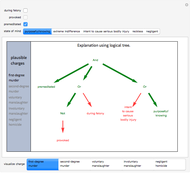
With "decision tree" view selected and with the advanced controls open, you select the cluster and the judge within each cluster. You also select the form for the the visualization of the decision tree. The factors used by the judges are labeled from "a" to "z". The logical and is represented as ∧; the logical or is represented as ∨; and logical nand is represented as &!;. Decision tree labels are suppressed when the number of decision factors is five or greater, unless the "force vertex labeling" control is checked.
If on a two-judge court, Judge 1 makes decisions on the basis of factors A, B and C, while Judge 2 makes decisions on the basis of factors B, C and D, there would be four factors that the judges collectively use to decide a case.
Political scientists have attempted to predict the decisions of United States Supreme Court justices on the basis of binary decision trees. See A. Martin, "Competing Approaches to Predicting Supreme Court Decision Making," Perspective on Politics, 2, 2004 p. 763.
Permanent Citation
"Correlated Binary Decision Rules"
http://demonstrations.wolfram.com/CorrelatedBinaryDecisionRules/
Wolfram Demonstrations Project
Published: March 7 2011
