Estimating the Time between Mishaps from Quality Control Data

Requires a Wolfram Notebook System
Interact on desktop, mobile and cloud with the free Wolfram Player or other Wolfram Language products.
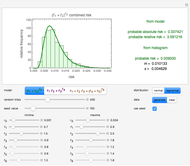
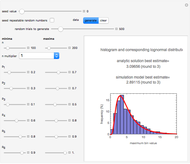
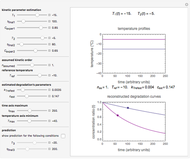
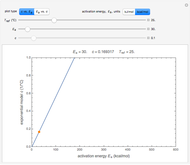
The random entries in the quality control charts of a stable process usually have a normal distribution. This implies that there is a probability that an entry or count exceeds or falls below some threshold level (an event we call a mishap). The mishap's frequency is determined by the normal distribution's parameters and the thresholds. This Demonstration simulates such charts, records the occurrences of mishaps, determines the time intervals between them, and plots their histogram. These statistics can serve as a tool in risk assessment. The histograms of the times to either exceed the upper threshold or fall below the lower one are special cases that can also be examined in the Demonstration.
Contributed by: Mark D. Normand and Micha Peleg (February 2013)
Open content licensed under CC BY-NC-SA
Snapshots
Details
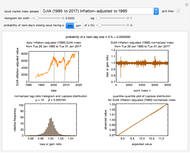
Snapshot 1: a simulated quality control chart of a safe process
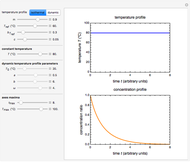
Snapshot 2: a simulated quality control chart of an unsafe process
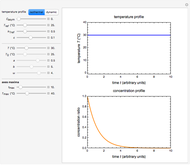
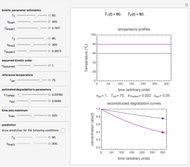
Snapshot 3: a simulated quality control chart with a high threshold only (one-sided)
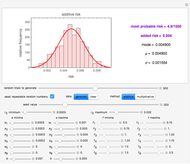
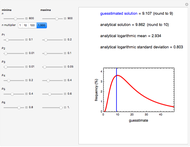
Snapshot 4: a simulated quality control chart with a low threshold only (one-sided)
Industrial quality control (QC) or quality assurance (QA) records of chemical and physical properties frequently resemble a randomly fluctuating time series whose entries have a normal distribution. The fluctuation pattern can be translated into the probability of a mishap, that is, surpassing a given upper threshold or falling below a lower one, using the distribution's parameters, be it normal or some other parametric distribution function [1, 2]. These parameters can also be used to estimate the distribution of the time intervals between mishaps, which can serve as an additional intuitive measure of the process's stability or safety.
In this Demonstration, you can enter the normal distribution parameters and the record's length with sliders. A record is then generated and the mishaps, of either or both kinds, are recorded. (The choices are: upper threshold only, lower threshold only, or both.) Since we assume that the data is entered at fixed time intervals, the mishap's index, i, is also a measure of its occurrence time in the corresponding units. The times between successive mishaps are calculated by the program and their histogram is plotted. When the record is sufficiently long and there is only a single threshold, high or low, the distribution of the times between successive mishaps is expected to approach a geometric or exponential distribution, with a mean determined by the entries' distribution parameters and the threshold level. In the case of two thresholds, the distribution's shape depends on the relative magnitudes of the upper and lower thresholds as well as on the distribution parameters.
For visualization, the Demonstration lets you choose and plot a section of the generated random record by using sliders to choose the indices of the initial and final entries. Superimposed on the plot are the upper and/or lower thresholds drawn as horizontal colored lines. The histogram of the times between successive mishaps is shown below, accompanied by the numerical values of their mean, standard deviation, median, and skewness.
References
[1] M. Peleg and J. Horowitz, "On Estimating the Probability of Aperiodic Outbursts of Microbial Populations from Their Fluctuating Counts," Bulletin of Mathematical Biology, 62(1), 2000 pp. 17–35. link.springer.com/article/10.1006%2 Fbulm .1999.0112.
[2] M. Peleg, A. Nussinovitch, and J. Horowitz, "Interpretation and Extraction of Useful information from Irregular Fluctuating Industrial Microbial Counts," Journal of Food Science, 65(5), 2000 pp. 740-747. onlinelibrary.wiley.com/doi/10.1111/j.1365-2621.2000.tb13580.x/abstract.
[3] C. Gonzalez-Martinez, M. G. Corradini, and M. Peleg, "Probabilistic Models of Food Microbial Safety and Nutritional Quality," Journal of Food Engineering, 56(2–3), 2003 pp. 135–142. www.sciencedirect.com/science/article/pii/S026087740200242X.
[4] M. Peleg, M. D. Normand, and M. G. Corradini, "A Study of the Randomly Fluctuating Microbial Counts in Foods and Water Using the Expanded Fermi Solution as a Model," Journal of Food Science 77, 2012 pp. R63–R71. onlinelibrary.wiley.com/doi/10.1111/j.1750-3841.2011.02469.x/abstract.
Permanent Citation
"Estimating the Time between Mishaps from Quality Control Data"
http://demonstrations.wolfram.com/EstimatingTheTimeBetweenMishapsFromQualityControlData/
Wolfram Demonstrations Project
Published: February 15 2013


