Land Use Regulation and Municipal Utility


Requires a Wolfram Notebook System
Interact on desktop, mobile and cloud with the free Wolfram Player or other Wolfram Language products.
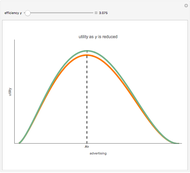
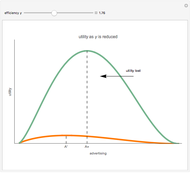
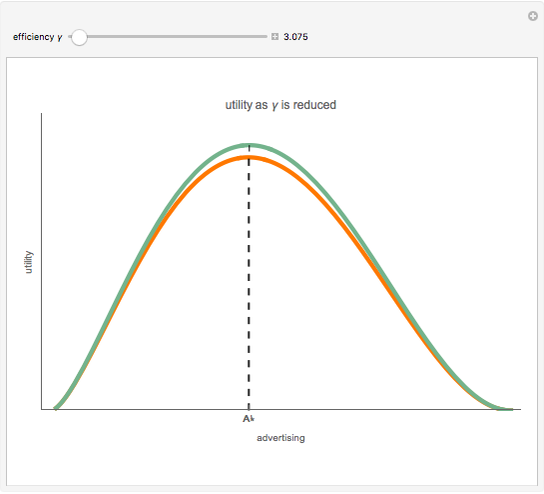
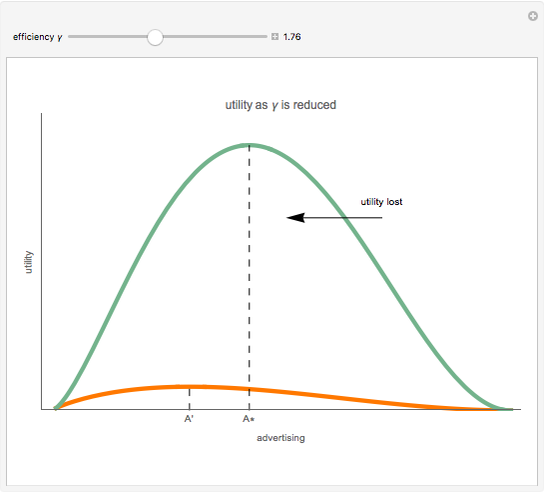
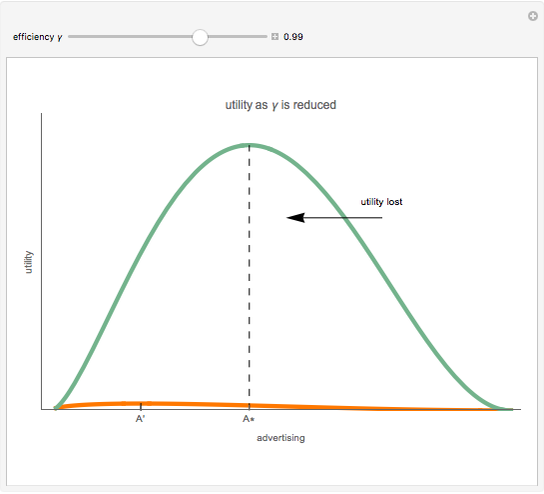
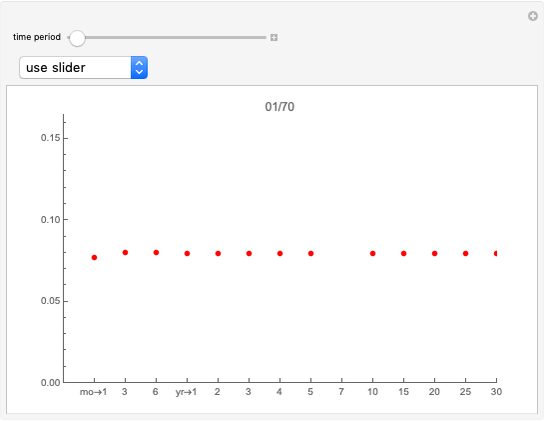
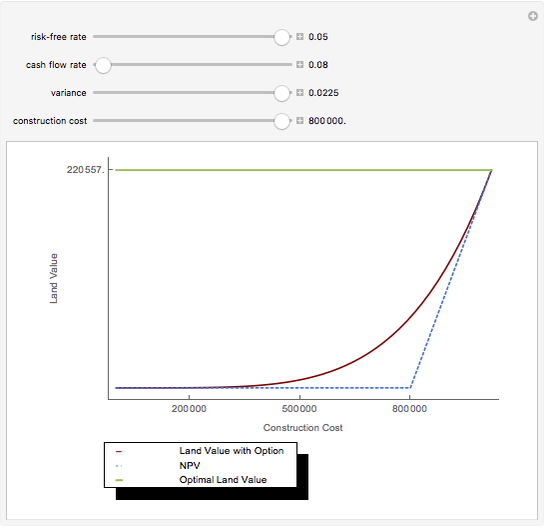
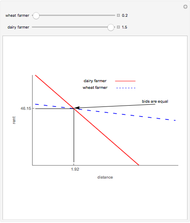
The bid-rent curve assumes competitive free market bidding, unfettered by government regulation: users locate where it is in their best interests to be, based solely on their individual profitability calculus. Such cases are rare in practice. Rather, significant regulation of land use is observed. Regulation comes at a cost. When measured at the municipal level, utility, the economic notion of well-being or improvement in circumstance, is lost when economic agents are constrained by regulation.
[more]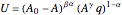


Contributed by: Roger J. Brown (March 2011)
Reproduced by permission of Academic Press from Private Real Estate Investment ©2005
Open content licensed under CC BY-NC-SA
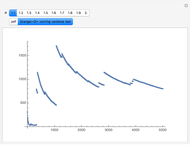
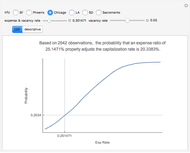
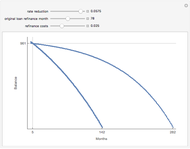
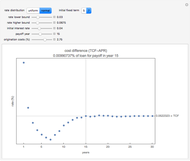
Snapshots
Details
The plot describes how an aesthetic regulation, modeled here as an ordinance regulating commercial signage, imposes uneconomic constraints on land users, restricting the efficiency of their activities on the land. Most models of social behavior are highly stylized and depend on a set of assumptions. This example is no different. The concept of utility resists quantification in that its cardinal value is unimportant, only its ordinal value matters. The Demonstration illustrates the power of using symbolic logic software to model complex concepts. There is an inherent conflict in property rights over providing municipal services (police and fire protection paid for with sales taxes) and a pleasant environment (absence of large, intrusive signs that generate sales to be taxed). To appreciate the Demonstration you must agree with the notion that the process of optimization in the presence of constraints is an accepted method of resolving conflicts in a civil society based on secular norms.
More information is available in Chapter Two of Private Real Estate Investment and at mathestate.com.
R. J. Brown, Private Real Estate Investment: Data Analysis and Decision Making, Burlington, MA: Elsevier Academic Press, 2005.
Permanent Citation
"Land Use Regulation and Municipal Utility"
http://demonstrations.wolfram.com/LandUseRegulationAndMunicipalUtility/
Wolfram Demonstrations Project
Published: March 7 2011
 Constant Risk Aversion Utility Functions
Seth J. Chandler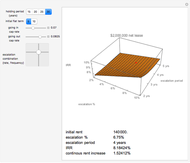 Net Lease Economics
Roger J. Brown The Effect of Holding Period on Real Estate Investment Return
Roger J. Brown Explaining Real Estate Price Bubbles
Roger J. Brown Value Added Growth Model
Roger J. Brown Risk, Ownership, and Control
Roger J. Brown Insurance Disclosures
Seth J. Chandler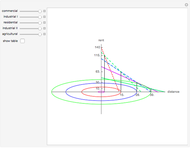 Location Theory - Land Use Determination
Roger J. Brown Minimal Model of Simulating Prices of Financial Securities Using an Iterated Finite Automaton
Philip Maymin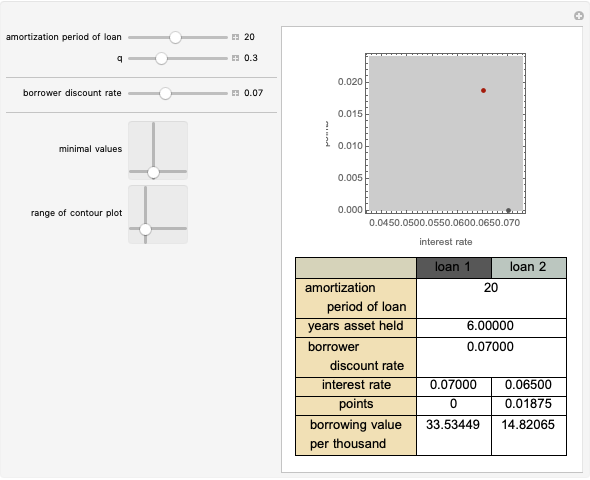 Pay the Points?
Seth J. Chandler
-
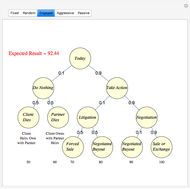 Dissolving Partnerships
Roger J. Brown -
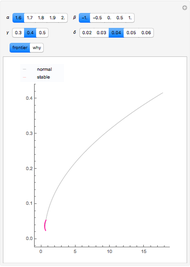 Forming the Efficient Frontier When Returns Are Non-Normal
Roger J. Brown -
 Spectral Measures
Roger J. Brown -
 Granger-Orr Running Variance Test
Roger J. Brown -
 Capitalization Rate Probability
Roger J. Brown -
Net Lease Economics
Roger J. Brown -
 The Refinance Decision
Roger J. Brown -
 True Cost of Variable Rate Mortgage Funds
Roger J. Brown -
 Term Structure of Interest Rates
Roger J. Brown -
 Generalized Central Limit Theorem
Roger J. Brown -
 Inflation-Adjusted Yield
Roger J. Brown -
 Simulating the IRR
Roger J. Brown -
 Real Options
Roger J. Brown -
 The Price-Terms Tradeoff
Roger J. Brown -
 Fitting an Elephant
Roger J. Brown -
 Solving the Subprime Loan Problem
Roger J. Brown -
 Why Location Matters: The Bid Rent Curve
Roger J. Brown -
Explaining Real Estate Price Bubbles
Roger J. Brown -
Value Added Growth Model
Roger J. Brown -
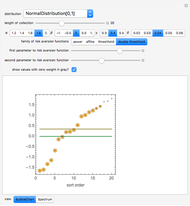
 Connecting the CDF and the PDF
Roger J. Brown