Uncertain Calculus: Mean versus Likelihood Mean


Requires a Wolfram Notebook System
Interact on desktop, mobile and cloud with the free Wolfram Player or other Wolfram Language products.
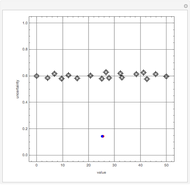
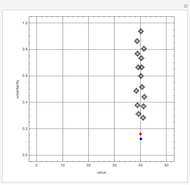
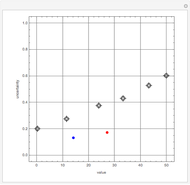
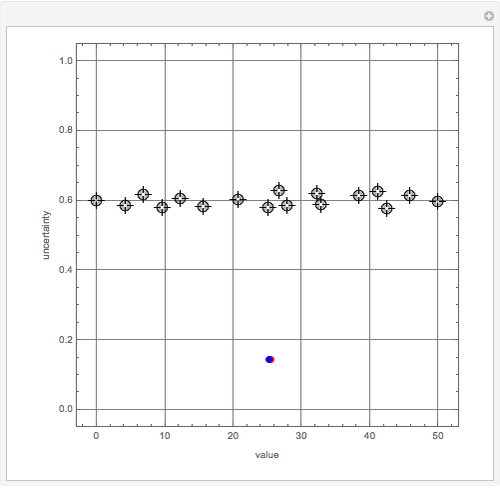
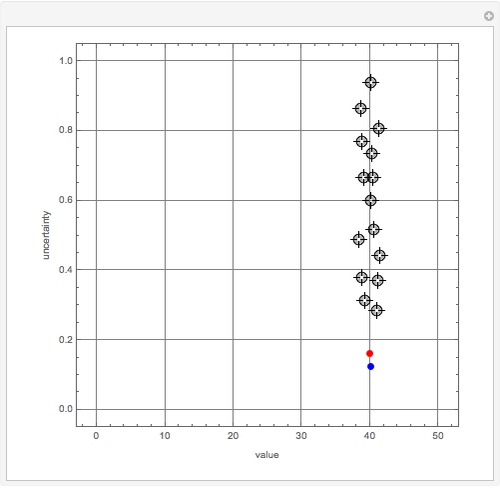
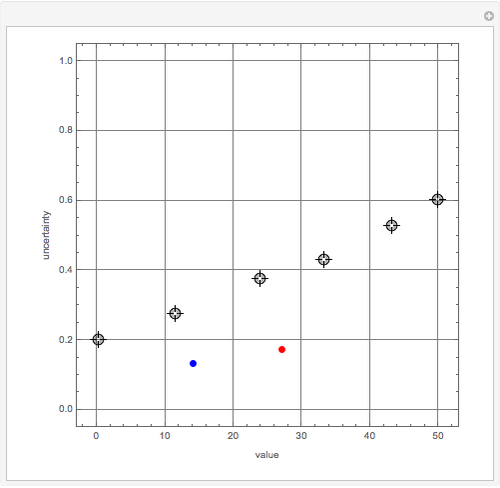
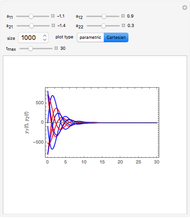
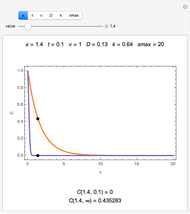
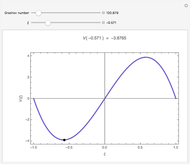
This Demonstration visualizes the mean of  measurements of the same quantity made by different methods, different laboratories, or different instruments. The measurements are given in the form of uncertain numbers
  , plotted as locators with coordinates
  . The red point gives the mean of all the points calculated by the uncertain calculus, while the mean of the blue points is computed by the likelihood method.
Contributed by: Valter Yoshihiko Aibe and Mikhail Dimitrov Mikhailov (INMETRO, Brazil) (March 2011)
Open content licensed under CC BY-NC-SA
Snapshots
Details
The uncertain calculus was introduced in [1] and explored in previous Demonstrations (see the Related Links). The uncertain calculus gives the formula implemented as the uncertainCalculusMean function, which computes the mean of the uncertain numbers defined by the locators and shown as a red point.
The likelihood method formulas are given in [2], eqs. 11.14 and 11.19, and Maximum Likelihood (Wolfram MathWorld), eqs. 19 and 24. These expressions and special cases are implemented as the likelihoodMean function that computes the coordinates of the blue point.
References:
[1] V. Y. Aibe and M. D. Mikhailov, "Uncertainty Calculus in Metrology," Proceedings of ENCIT 2008, 12th Brazilian Congress of Thermal Engineering and Sciences, Belo Horizonte, MG, Brazil, November 10–14, 2008.
[2] José Henrique Vuolo, Fundamentos da Teoria de Erros, 2nd ed., 2nd printing, Sao Paulo, Brazil: Edgar Blucher, LTDA, 2000.
Permanent Citation
"Uncertain Calculus: Mean versus Likelihood Mean"
http://demonstrations.wolfram.com/UncertainCalculusMeanVersusLikelihoodMean/
Wolfram Demonstrations Project
Published: March 7 2011
 Mean, Median, Mode
Ed Pegg Jr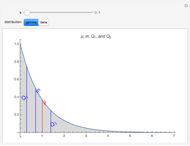 Mean, Median, and Quartiles in Skewed Distributions
Ian McLeod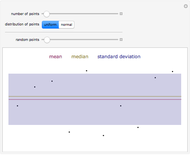 Mean, Median, and Standard Deviation for Random Values
Stephen Wolfram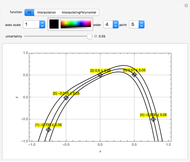 Fit, Interpolation, or Polynomial Interpolation in Uncertain Calculus
Valter Yoshihiko Aibe and Mikhail Dimitrov Mikhailov, INMETRO, Brazil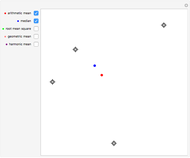 Basic Statistics of Movable Points
Stephen Wolfram Maximum Entropy Probability Density Functions
Marshall Bradley Stochastic Gradient Descent
Anthony Fox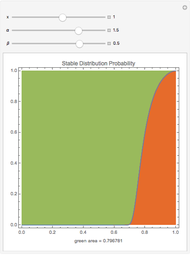 Stable Distribution Computed with the Zolotarev Integral
Bob Rimmer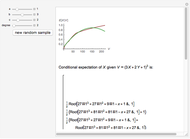 Estimating Conditional Expectations with Monte Carlo Simulation and Least Squares Regression
Andrzej Kozlowski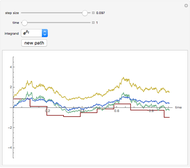 The Itô Integral and Itô's Lemma
Andrzej Kozlowski
-
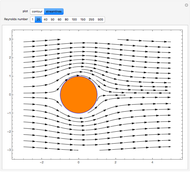 Flow around a Sphere at Finite Reynolds Number by Galerkin Method
Mikhail Dimitrov Mikhailov -
Fit, Interpolation, or Polynomial Interpolation in Uncertain Calculus
Mikhail Dimitrov Mikhailov -
 An Expert System Specific to Improving Personal Relationships
Mikhail Dimitrov Mikhailov -
 Visualizing the Solution of Two Linear Differential Equations
Mikhail Dimitrov Mikhailov -
 Checking Finite Difference Errors
Mikhail Dimitrov Mikhailov -
 Concentrations of Multiple Reacting Species in a Semi-Infinite Region
Mikhail Dimitrov Mikhailov -
 Uncertain Calculus: Mean versus Likelihood Mean
Mikhail Dimitrov Mikhailov -
 Velocity Stream Lines from Superposition of Elementary Fluid Flows
Mikhail Dimitrov Mikhailov -
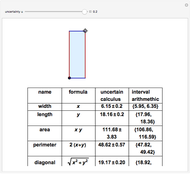 Area, Perimeter, and Diagonal of a Rectangle with Uncertain Sides
Mikhail Dimitrov Mikhailov -
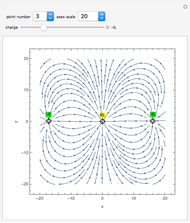 Vector Field with Sources and Sinks
Mikhail Dimitrov Mikhailov -
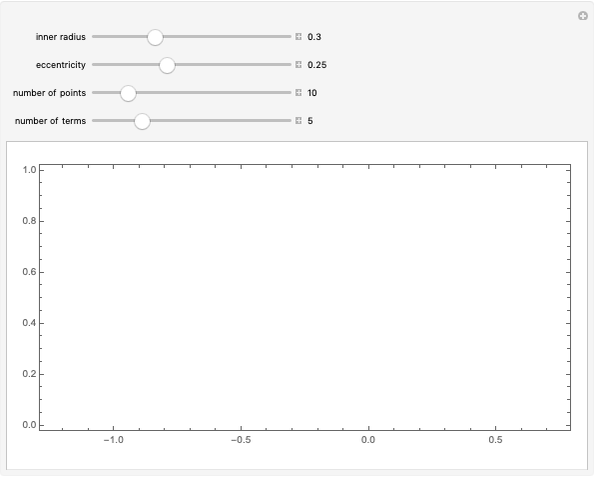 Laminar Flow between Two Eccentric Tubes
Mikhail Dimitrov Mikhailov -
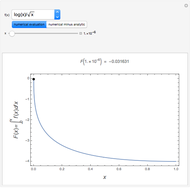 Numerical Evaluation of Some Definite Integrals
Mikhail Dimitrov Mikhailov -
 Convection-Diffusion in a Semi-Infinite Region
Mikhail Dimitrov Mikhailov -
 Solving Matrix Systems with Real, Interval, or Uncertain Elements
Mikhail Dimitrov Mikhailov -
 Solving a Linear System with Uncertain Coefficients
Mikhail Dimitrov Mikhailov -
 Expert System for Identifying Pedigree Dogs
Mikhail Dimitrov Mikhailov -
 Natural Convection between Two Vertical Plates
Mikhail Dimitrov Mikhailov -
 Penetration of Potential in a Semi-Infinite Region
Mikhail Dimitrov Mikhailov -
 Derivation of Thermodynamic Derivatives Using Jacobians
Mikhail Dimitrov Mikhailov -
 Finite Difference Schemes of One Variable
Mikhail Dimitrov Mikhailov