Visualizing the Solution of Two Linear Differential Equations


Requires a Wolfram Notebook System
Interact on desktop, mobile and cloud with the free Wolfram Player or other Wolfram Language products.
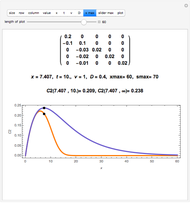
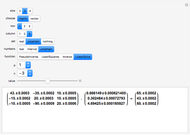
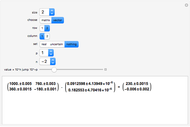
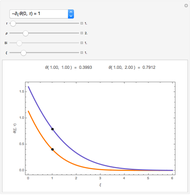
The analytical solutions of the two differential equations  and
and  , subject to the initial conditions
  and
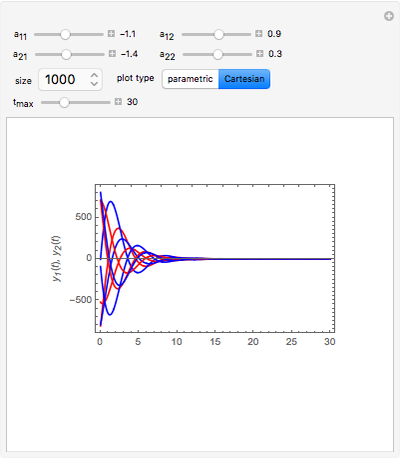
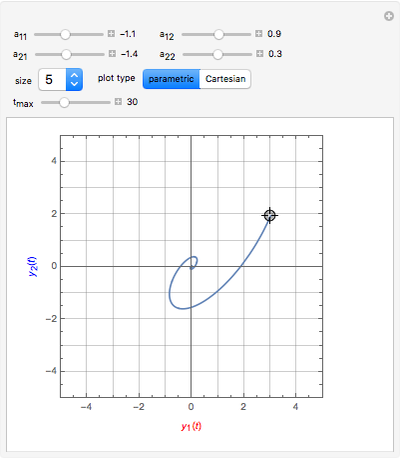
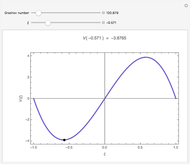
and  are used to create two plots, a parametric plot of a curve with horizontal coordinate
  and vertical coordinate
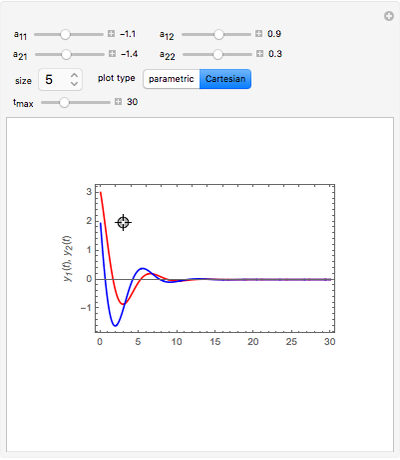
  and a standard plot of and as functions of
  from 0 to
  .
.


Contributed by: Mikhail Dimitrov Mikhailov (March 2011)
Open content licensed under CC BY-NC-SA
Snapshots


Details
The expressions for and given by the Mathematica built-in function DSolve are not applicable when  . For this special case the solutions are simplified using Mathematica's Limit function. Thus our function twoDSolve correctly computes and for all parameters specified.
Permanent Citation
 Phase Portrait and Field Directions of Two-Dimensional Linear Systems of ODEs
Santos Bravo Yuste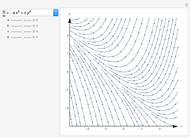 Families of Solutions for ODEs
Gosia Konwerska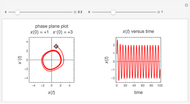 Phase Plane Plot of the Van der Pol Differential Equation
Nasser M. Abbasi Bifurcation Diagrams with Flow Fields
Suba Thomas Competition for Territory: The Levins Model for Two Species
Irma Szimjanovszki, Janos Karsai (University of Szeged, Hungary), and Eva Veronika Racz (Szechenyi Istvan University, Gyor, Hungary)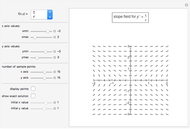 Slope Fields
Charles E. Oelsner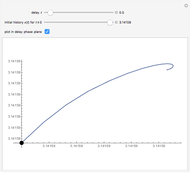 Ikeda Delay Differential Equation
Rob Knapp Behavior of Equilibrium Points in Two-Dimensional Systems of Differential Equations
Akshay Jaggi and Raymond Yuan Direction Fields for Differential Equations
Stephen Wilkerson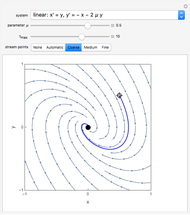 A Tour of Second-Order Ordinary Differential Equations
Brian Vick
-
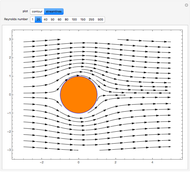 Flow around a Sphere at Finite Reynolds Number by Galerkin Method
Mikhail Dimitrov Mikhailov -
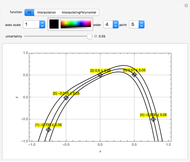 Fit, Interpolation, or Polynomial Interpolation in Uncertain Calculus
Mikhail Dimitrov Mikhailov -
 An Expert System Specific to Improving Personal Relationships
Mikhail Dimitrov Mikhailov -
 Visualizing the Solution of Two Linear Differential Equations
Mikhail Dimitrov Mikhailov -
 Checking Finite Difference Errors
Mikhail Dimitrov Mikhailov -
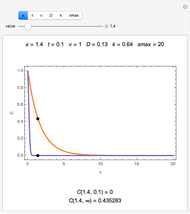
 Concentrations of Multiple Reacting Species in a Semi-Infinite Region
Mikhail Dimitrov Mikhailov -
 Uncertain Calculus: Mean versus Likelihood Mean
Mikhail Dimitrov Mikhailov -
 Velocity Stream Lines from Superposition of Elementary Fluid Flows
Mikhail Dimitrov Mikhailov -
 Area, Perimeter, and Diagonal of a Rectangle with Uncertain Sides
Mikhail Dimitrov Mikhailov -
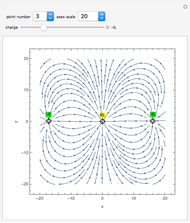 Vector Field with Sources and Sinks
Mikhail Dimitrov Mikhailov -
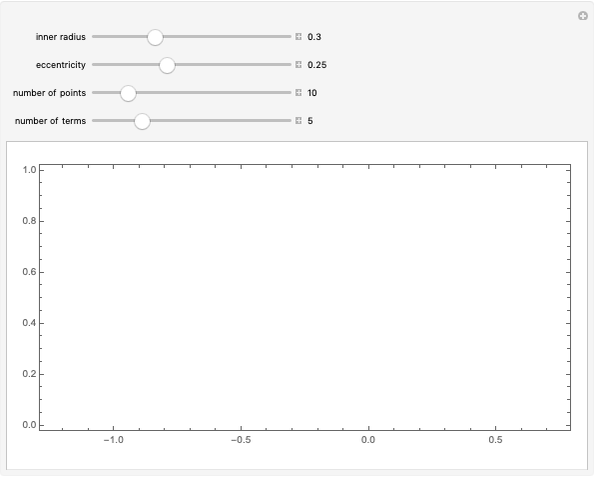 Laminar Flow between Two Eccentric Tubes
Mikhail Dimitrov Mikhailov -
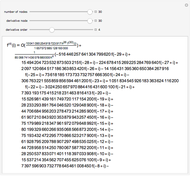
 Numerical Evaluation of Some Definite Integrals
Mikhail Dimitrov Mikhailov -
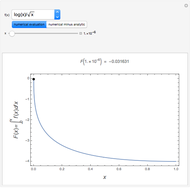
 Convection-Diffusion in a Semi-Infinite Region
Mikhail Dimitrov Mikhailov -
 Solving Matrix Systems with Real, Interval, or Uncertain Elements
Mikhail Dimitrov Mikhailov -
 Solving a Linear System with Uncertain Coefficients
Mikhail Dimitrov Mikhailov -
 Expert System for Identifying Pedigree Dogs
Mikhail Dimitrov Mikhailov -
 Natural Convection between Two Vertical Plates
Mikhail Dimitrov Mikhailov -
 Penetration of Potential in a Semi-Infinite Region
Mikhail Dimitrov Mikhailov -
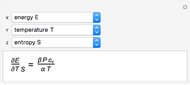 Derivation of Thermodynamic Derivatives Using Jacobians
Mikhail Dimitrov Mikhailov -
 Finite Difference Schemes of One Variable
Mikhail Dimitrov Mikhailov