Pricing a European-Style Arithmetic Asian Option: Comparing Bootstrapping and Simulation Approaches

Requires a Wolfram Notebook System
Interact on desktop, mobile and cloud with the free Wolfram Player or other Wolfram Language products.
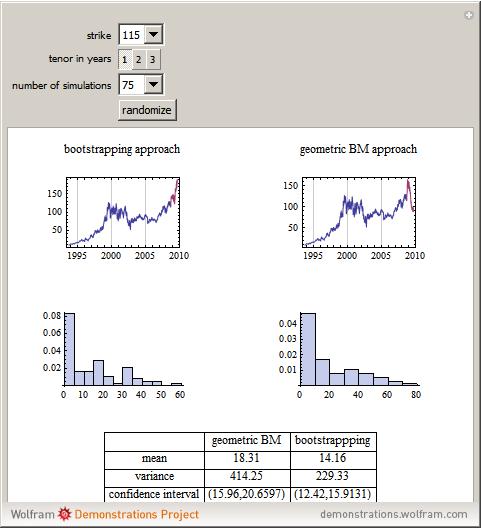
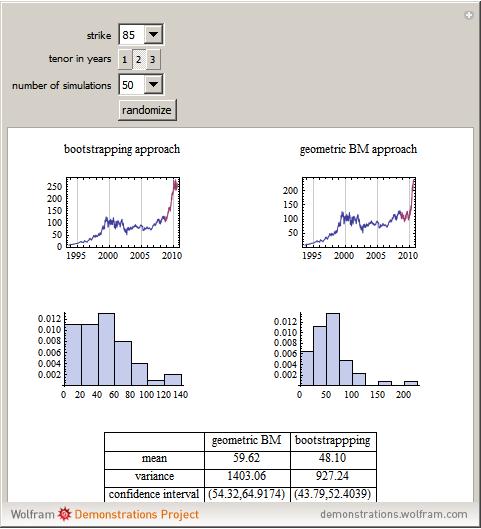
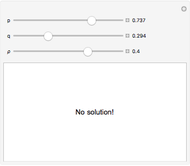
As of September 5, 2008, set the time to expiration and the strike price to price a European-style arithmetic Asian option on IBM stock. In general, there are no closed-form solutions for the value function of an Asian option (unlike European puts and calls under the Black–Scholes framework), so an efficient Monte Carlo pricing technique must be used instead. We compare and contrast two different simulation approaches: simulating the sample paths of geometric Brownian motion and bootstrapping sample paths directly from historical data.
Contributed by: Jeff Hamrick (March 2011)
Open content licensed under CC BY-NC-SA
Snapshots
Details
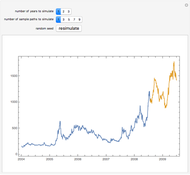
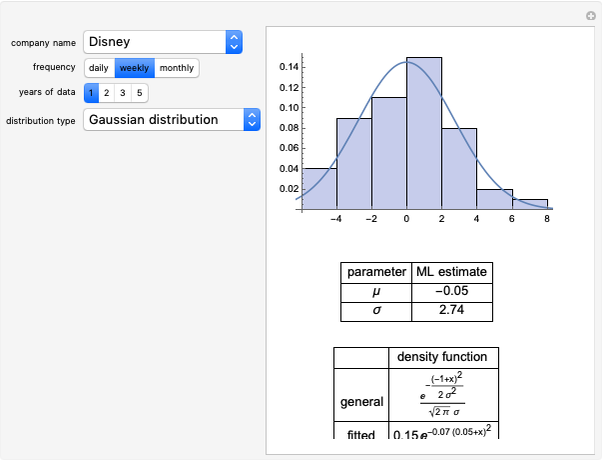
In this Demonstration, two different approaches are taken to pricing a European-style arithmetic Asian option. Take the past 15 years of IBM stock data, assume the data are generated by a geometric Brownian motion, estimate the drift and diffusion coefficients of the geometric Brownian motion, simulate sample paths, price a European-style arithmetic Asian option along each sample path, and then generate histograms and other summary statistics.
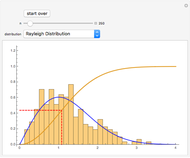
Alternatively, take the past 15 years of IBM stock data and make no assumption about the underlying model that generates the data, other than that the log-returns of the stock data are independent and identically distributed. Simulate sample paths by directly bootstrapping from the histogram log-returns of the data, price an arithmetic Asian European option along each sample path, and then generate histograms and other summary statistics.
Consistently, the price of the option is lower under the bootstrapping approach because the bootstrapping approach effectively captures the heavy left tail and leptokurtosis found in IBM stock's historical log-returns. If you assume that IBM stock's log-returns are normally distributed, then both the left and right tails will be exponentially light, a feature that is inconsistent with historical data. Moreover, without the heavy left tail causing some of the sample paths to crash, the very positive drift term—IBM has appreciated an average of about 18% per year over the past fifteen years—will cause the geometric Brownian motion approach to overstate the value of the option.
 Monte Carlo Valuation of an Option
N. T. Gladd Two-Regime Threshold Autoregressive Model Simulation
Jozef Barunik Stock Price Probability with Stable Distributions
Bob Rimmer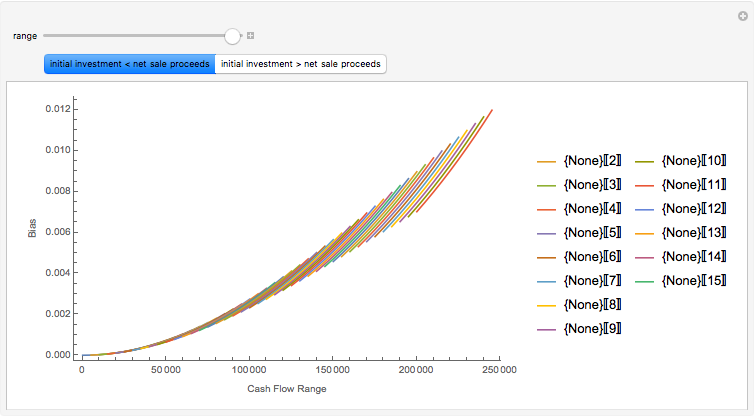 Simulating the IRR
Roger J. Brown Simulating the Poisson Process
Heikki Ruskeepää The Method of Common Random Numbers: An Example
Jeff Hamrick Expected Returns of the Dow Industrials, Fama-French Model
Jeff Hamrick and Jason Cawley Option Prices in the Variance Gamma Model
Andrzej Kozlowski Stock Price Simulation Using Stable Random Variables
Bob Rimmer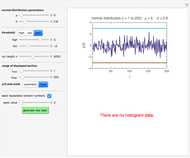 Estimating the Time between Mishaps from Quality Control Data
Mark D. Normand and Micha Peleg
-
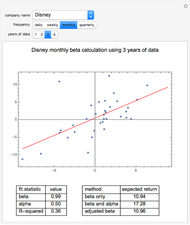 Expected Returns of the Dow Industrials, Beta Model
Jeff Hamrick -
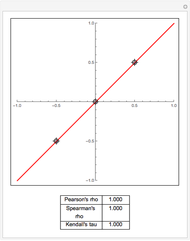 Exploring Measures of Association
Jeff Hamrick -
 Bootstrapping Credit Default Swap Data
Jeff Hamrick -
 Linear Dependence between Two Bernoulli Random Variables
Jeff Hamrick -
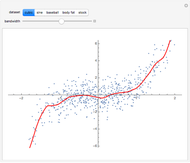 Estimating the Local Mean Function
Jeff Hamrick -
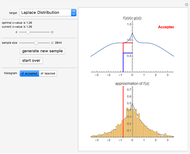 Acceptance/Rejection Sampling
Jeff Hamrick -
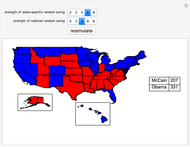 Simulating the 2008 U.S. Presidential Election
Jeff Hamrick -
 The Method of Inverse Transforms
Jeff Hamrick -
 The Perturbed Rat
Jeff Hamrick -
 Modeling Return Distributions
Jeff Hamrick -
 Pricing a European-Style Arithmetic Asian Option: Comparing Bootstrapping and Simulation Approaches
Jeff Hamrick -
The Method of Common Random Numbers: An Example
Jeff Hamrick -
 The Envelope Theorem: Numerical Examples
Jeff Hamrick -
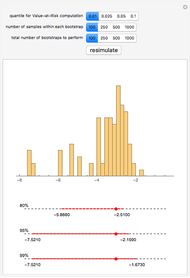 Bootstrapping to Compute Value-at-Risk Standard Errors
Jeff Hamrick -
Expected Returns of the Dow Industrials, Fama-French Model
Jeff Hamrick -
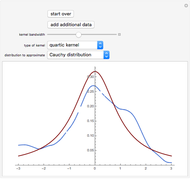 Kernel Density Estimation
Jeff Hamrick -
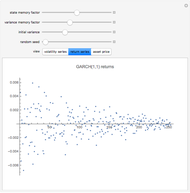 Simulating Asset Prices with a GARCH(1,1) Model
Jeff Hamrick