Throwing a Die to Score 100 Points

Requires a Wolfram Notebook System
Interact on desktop, mobile and cloud with the free Wolfram Player or other Wolfram Language products.
A score of 100 points wins a certain dice game. Each turn, a player rolls a single die as many times as they like, and gains either zero points if a 1 is ever rolled or else the total of their rolls. After a turn, the score for the turn is added to their total score. Other players are also competing to reach 100 points first.
[more]
Contributed by: Heikki Ruskeepää (March 2012)
Open content licensed under CC BY-NC-SA
Snapshots
Details
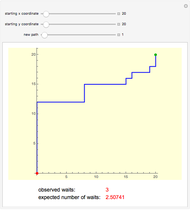
Snapshot 1: 10 sample paths to get 100 points (threshold is 20)
In one of the 10 sample paths, the player achieves 100 points in 5 turns (she gets no 1's), but two other paths require 21 turns to get 100 points. A path is horizontal when the player has got one or more 1's, so that the total score does not grow. For example, one of the players that need 21 turns first gets 8 times 0 points. In this case, use a small number of simulated games, like 1, 10, or 20 (for larger values the plot becomes unclear).
Snapshot 2: histogram, based on 1000 simulations, of the number of turns needed to get 100 points (threshold is 20)
Among the 1000 simulated games, in 15 games we only needed five turns to get 100 points, but one game needed 34 turns. The most frequent case (or the mode) is the one where we need 11 turns (there were 102 such games), but the average number of needed turns is 12.749.
Snapshot 3: average number of turns needed to get 100 points for each threshold value, based on 100,000 simulations
A minimum among the average number of turns needed to get 100 points occurs when the threshold value is 20. However, the averages form quite a flat curve from, say, 15 to 25, so that there is not much difference for any of these threshold values. Using a threshold value smaller than, say, 10 or larger than, say, 40 results in an average that is clearly inferior. The averages were calculated beforehand (not in the Demonstration).
Snapshot 4: shows that it is optimal to use the threshold value 20
From the table we can read what is optimal to do in each situation (the optimal strategy maximizes the expected score in a turn). For example, if we already have thrown the die three times and we already have 12 points, we should continue throwing. However, if we already have 20 points, then—regardless of the number of throws—we should stop throwing. The expected score is then 8.14.
Let  be the maximum expected score with
  throws and
  points so far. Also let
  be the decision that gives the maximum expected score with
  throws and
  points so far; the decision is either ”continue” or ”stop” throwing.
If we stop throwing, then  . If we continue throwing, then
  ; thus, we arrive at a recursive formula. It also follows that
  is ”stop” or ”continue” according to which of
  or
or  is the largest. Let us choose a maximum number of throws,
  . Then, evidently,
  .
.
We would like to know  , that is, the maximum expected score, when we have not yet thrown the die. The fine point of dynamic programming with Mathematica is that Mathematica automatically does all the lengthy recursive calculations. We only have to ask the value of
  ! After that, we tabulate the values of
  . From the table, we can see the optimal action for each value of
  and
and  .
.
Permanent Citation


