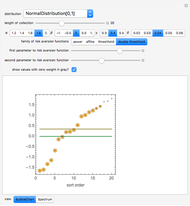
Graph Embedding Trajectories


Requires a Wolfram Notebook System
Interact on desktop, mobile and cloud with the free Wolfram Player or other Wolfram Language products.
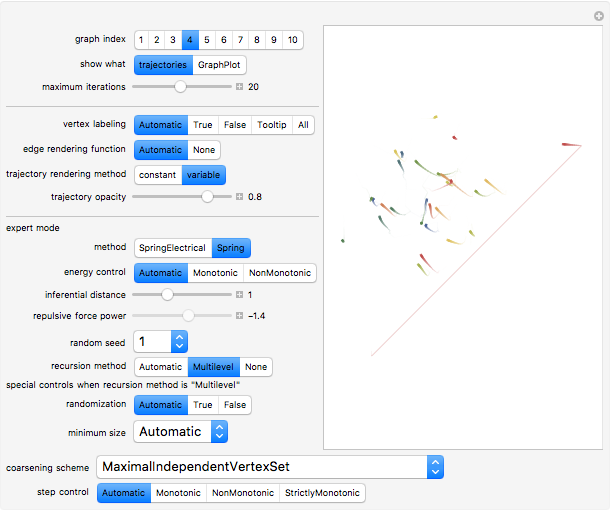
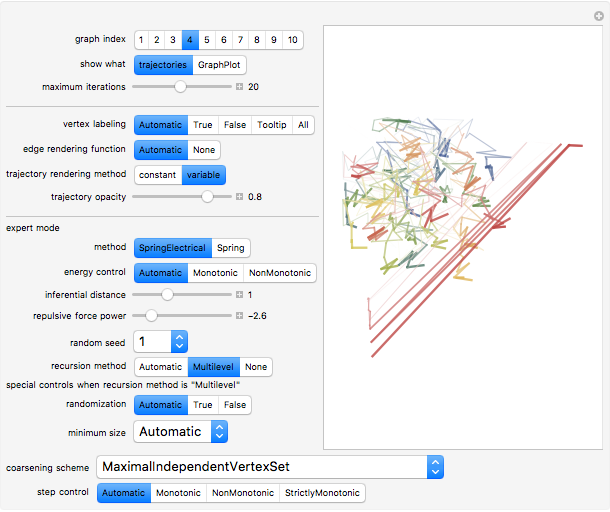
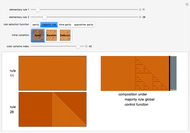
The computation of vertex coordinates for the display of a graph often proceeds through an iterative algorithm. This Demonstration shows this iterative process in two ways for 11 different random graphs. By selecting "show what" to be trajectories, you see a graphic in which the trajectory of each vertex appears as a colored line with a point at the end; each vertex has its own signature color. A second set of controls lets you control aspects of the visualization of either the GraphPlot or the trajectories. In the case of a GraphPlot, you control how the vertices are labeled and whether the edges are shown. In the case of trajectories, you control the opacity of the lines. A third set of "expert mode" controls enables advanced modifications of the iterative process using many of the options of the GraphPlot command.
Contributed by: Seth J. Chandler (March 2011)
Open content licensed under CC BY-NC-SA
Snapshots

Details
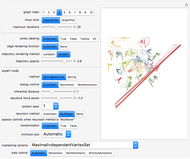
Snapshot 1: trajectories of graph 4 with a spring electrical embedding and trajectories drawn with variable color and thickness
Snapshot 2: trajectories of graph 4 with a spring embedding and trajectories drawn with variable color and thickness
Snapshot 3: trajectories of graph 4 with a spring electrical embedding and trajectories drawn with variable color and thickness but induced by a higher absolute repulsive force power
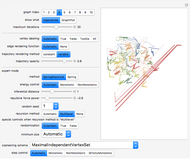
Snapshot 4: a GraphPlot of the  iteration of graph 8
Snapshot 5: a GraphPlot of the  iteration of graph 8
Snapshot 6: a GraphPlot of the iteration of graph 8 with a different starting random seed
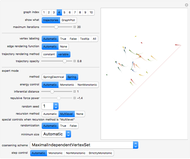
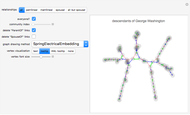
Snapshot 7: trajectories of graph 3 with a spring electrical embedding using "Multilevel" recursion and the "MaximalIndependentEdgeSet" coarsening scheme
Snapshot 8: trajectories of graph 3 with a spring electrical embedding using "Multilevel" recursion and "MaximalIndependentVertexRugeStuben" coarsening scheme
Snapshot 9: trajectories of graph 3 with a spring electrical embedding using "Multilevel" recursion and "StrictlyMonotonic" step control
The "variable" method of trajectory rendering partitions each trajectory and applies different graphic directives to each segment of the trajectory. Later "moves" within the trajectory are thicker and darker.
Information on the expert controls may be found in the "General Graph Drawing" tutorial in the standard Mathematica documentation.
Permanent Citation
 Genealogy Graphs from XML
Seth J. Chandler Solving Hard Traveling Salesman Problems
Heikki Ruskeepää Planar Graph Embeddings
Ed Pegg Jr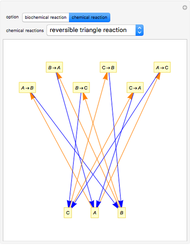 Volpert Graph of Chemical Reactions
Attila Nagy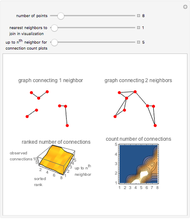 Nearest Neighbor Graph Connections
Jim Gerdy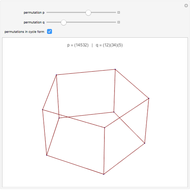 Cayley Graphs
Ed Pegg Jr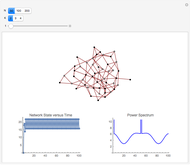 Boolean NK Networks
Garrett Neske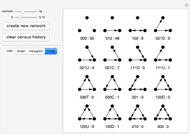 Triad Census on Random Graphs
Philip S. Lu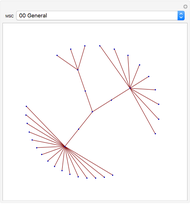 Mathematics Subject Classification Graphs
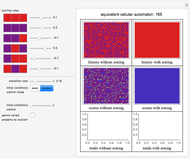
Michael Schreiber Four-Color Outer Median Cellular Automata on Graphs
Abigail Nussey
-
 Post-Event Bonding
Seth J. Chandler -
 Emulating Land Use Evolution with a Cellular Automaton
Seth J. Chandler -
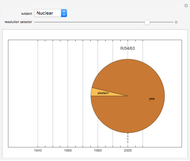 General Assembly Resolution Viewer
Seth J. Chandler -
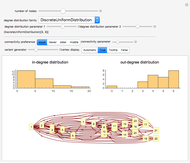 Random Acyclic Networks
Seth J. Chandler -
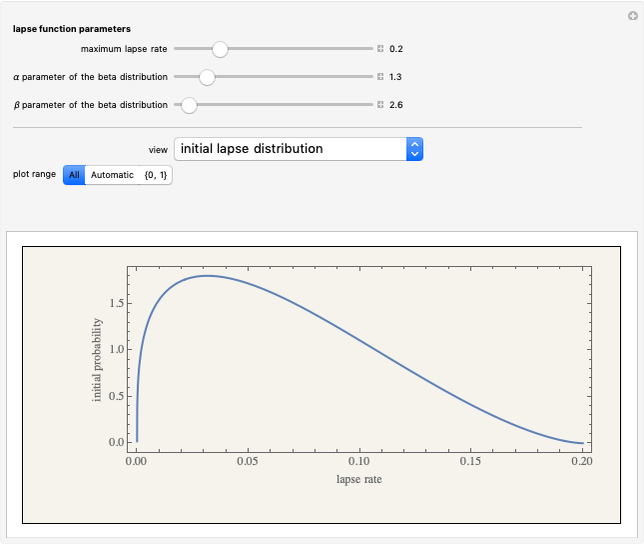 A Theory of Insurance Lapses
Seth J. Chandler -
 Asylum in the United States
Seth J. Chandler -
 Property Coinsurance
Seth J. Chandler -
 The Persuasion Effect: A Traditional Two-Stage Jury Model
Seth J. Chandler -
 Cellular Automata with Global Control
Seth J. Chandler -
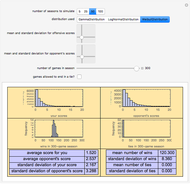 Sports Seasons Based on Score Distributions
Seth J. Chandler -
 Evidentiary Uncertainty
Seth J. Chandler -
 Spectral Measures
Seth J. Chandler -
 The Banzhaf Power Index of States for Presidential Candidates
Seth J. Chandler -
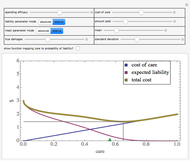
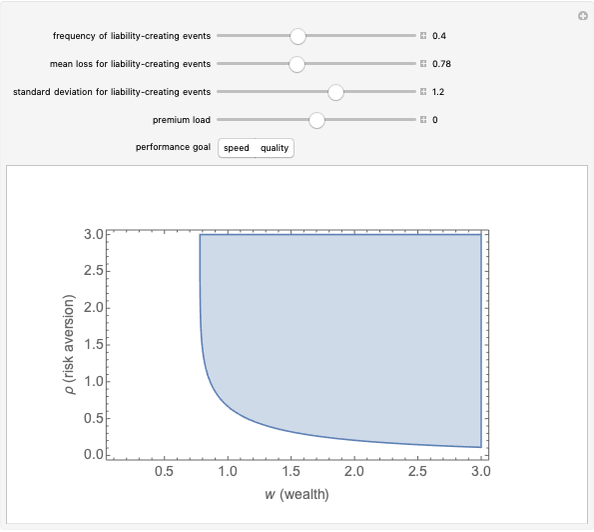 Liability Insurance Desirability under Lognormal Loss Distributions
Seth J. Chandler -
 The Effects of Coinsurance and Deductibles on Optimal Precautions for Weibull-Distributed Loss
Seth J. Chandler -
 Collocation by Chi Square
Seth J. Chandler -
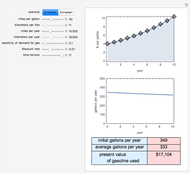 The Present Value of Future Gas Use
Seth J. Chandler -
 Visualizing Legal Rules: A Homicide Case
Seth J. Chandler -
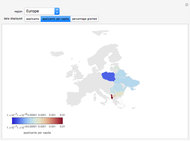
 Communities of Nations Bridged by Language Similarity
Seth J. Chandler