Estimating Loss Functions Using Exceedance Data and the Method of Moments


Requires a Wolfram Notebook System
Interact on desktop, mobile and cloud with the free Wolfram Player or other Wolfram Language products.
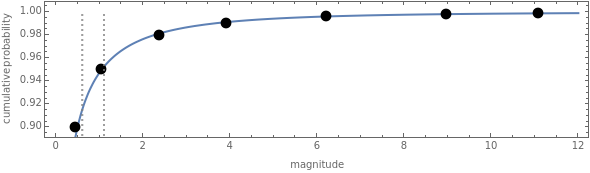
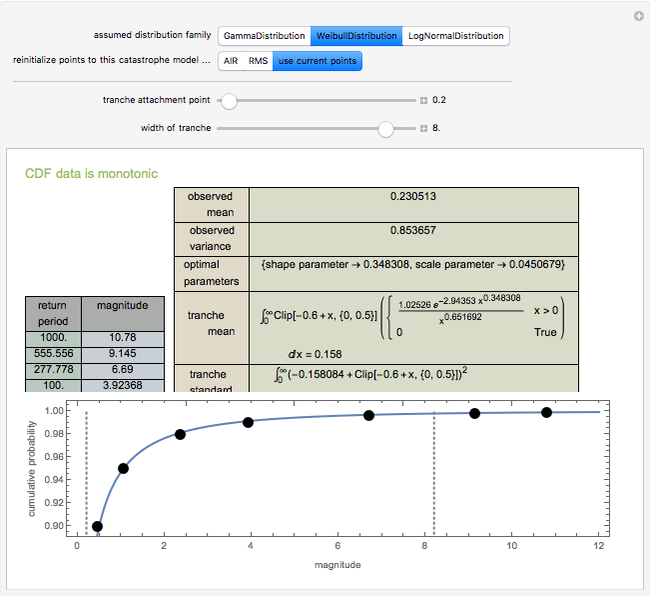
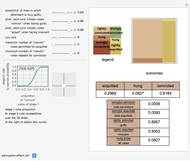
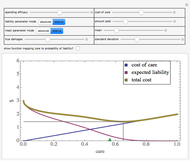
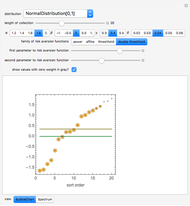
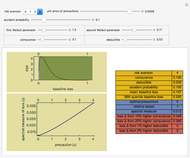
Data regarding the magnitude of catastrophes is often presented in an "exceedance table" that sets forth the number of years it would take for disasters exceeding various magnitudes to occur. This Demonstration shows how one can use exceedance data to generate a two-parameter probability distribution whose first two moments best match those observed from the data. You move locators to set a cumulative density function and determine the family of distributions for which parameters are to be estimated. The Demonstration responds by determining the parameters of that distribution whose first two moments match the observed values. A second part of the Demonstration lets you use the computed probability distribution. You move the sliders to establish a layer (or "tranche", as it is often known) for which an insurer has responsibility. An insurer might, for example, have to pay the difference between the insured's loss and 0.6, with that value clipped between zero and 0.5. In the trade, this would be called a "0.5 XS 0.6 policy". The Demonstration uses the computed probability distribution to determine the expected value and standard deviation of the payments an insurer writing such a tranche would face. These statistics are often relevant to the premium the insurer wishes to charge. A warning is provided if the cumulative density function violates monotonicity or if the algorithm for finding optimal parameters fails. You can also reinitialize the points to correspond with estimates provided by two catastrophe modelers, AIR Worldwide Corporation (AIR) and Risk Management Solutions, Inc. (RMS).
Contributed by: Seth J. Chandler (March 2011)
Open content licensed under CC BY-NC-SA
Snapshots


Details
The default data is taken from work submitted by the Texas Windstorm Insurance Association (TWIA) to regulators in 2008 regarding the likely magnitude of insured damages caused by hurricanes striking the Texas coast during the forthcoming 2008-09 hurricane season. The data was originally generated by the catastrophe modeling firms AIR and RMS. All numbers are actually in billions of dollars.
Some research suggests that the premium an insurer will charge should be equal to the expected loss plus a coefficient times the standard deviation of the loss.
The method of moments has the virtue of being extremely fast; it is not, however, a maximum likelihood estimator.
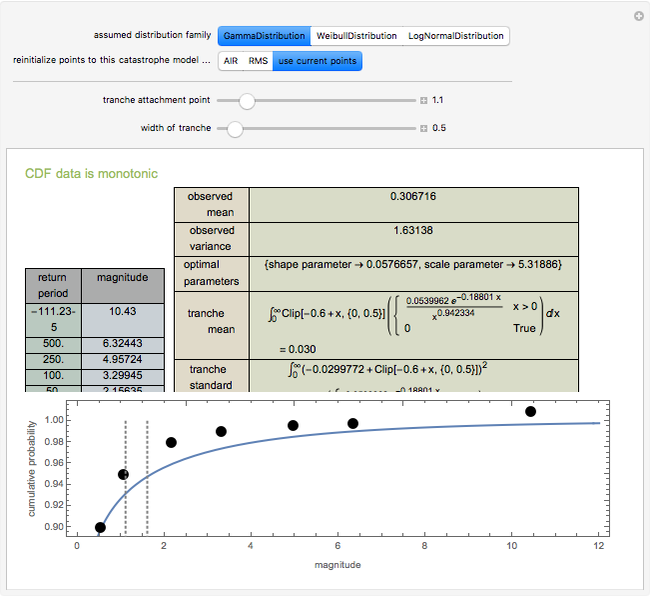
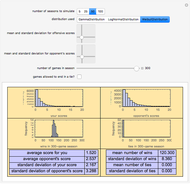
Snapshot 1: fitting the RMS data to a gamma distribution and examining a tranche between 1.1 and 1.6
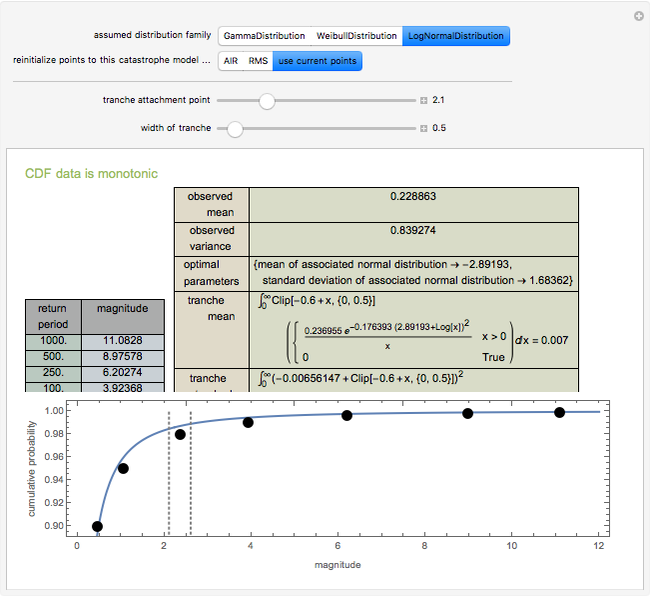
Snapshot 2: fitting the AIR data to a log normal distribution and examining a tranche between 2.1 and 2.6
Snapshot 3: fitting user-modified data to a Weibull distribution and examining a large tranche between 0.2 and 8
Snapshot 4: how the system deals with non-monotonic cumulative distribution functions
 Estimating Insurance Premiums Using Exceedance Data and the Method of Moments
Seth J. Chandler Efficient Single Limit Liability Insurance
Seth J. Chandler The Duty to Settle
Seth J. Chandler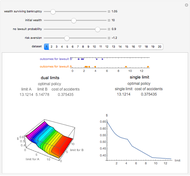 The Efficient Dual-Limit Liability Insurance Contract
Seth J. Chandler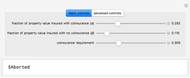 Property Coinsurance
Seth J. Chandler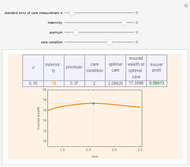 Moral Hazard
Seth J. Chandler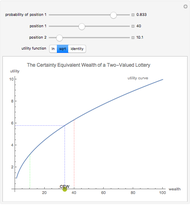 Certainty Equivalent Wealth
Seth J. Chandler Insurance Disclosures
Seth J. Chandler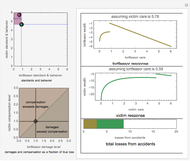 Bilateral Accident Model
Seth J. Chandler Tax Rates and Tax Revenue
Seth J. Chandler
-
 Post-Event Bonding
Seth J. Chandler -
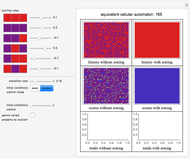 Emulating Land Use Evolution with a Cellular Automaton
Seth J. Chandler -
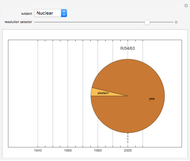 General Assembly Resolution Viewer
Seth J. Chandler -
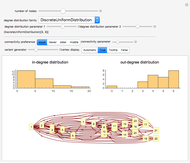 Random Acyclic Networks
Seth J. Chandler -
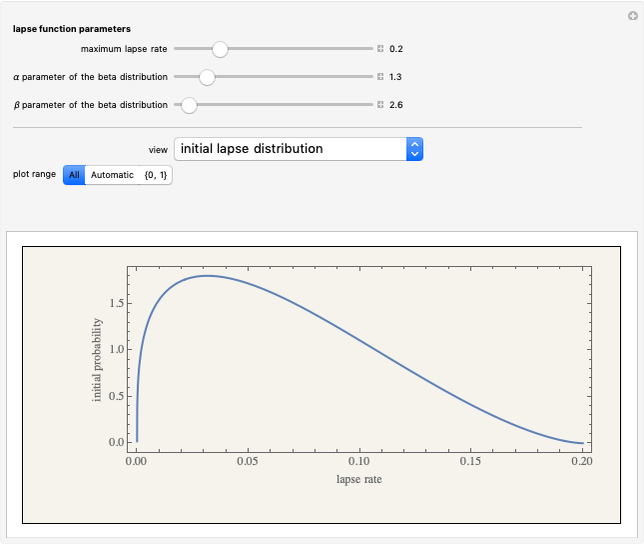 A Theory of Insurance Lapses
Seth J. Chandler -
 Asylum in the United States
Seth J. Chandler -
Property Coinsurance
Seth J. Chandler -
 The Persuasion Effect: A Traditional Two-Stage Jury Model
Seth J. Chandler -
 Cellular Automata with Global Control
Seth J. Chandler -
 Sports Seasons Based on Score Distributions
Seth J. Chandler -
 Evidentiary Uncertainty
Seth J. Chandler -
 Spectral Measures
Seth J. Chandler -
 The Banzhaf Power Index of States for Presidential Candidates
Seth J. Chandler -
 Liability Insurance Desirability under Lognormal Loss Distributions
Seth J. Chandler -
 The Effects of Coinsurance and Deductibles on Optimal Precautions for Weibull-Distributed Loss
Seth J. Chandler -
 Collocation by Chi Square
Seth J. Chandler -
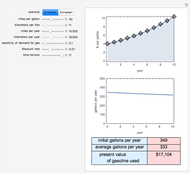 The Present Value of Future Gas Use
Seth J. Chandler -
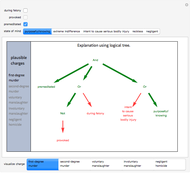 Visualizing Legal Rules: A Homicide Case
Seth J. Chandler -
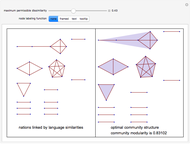 Communities of Nations Bridged by Language Similarity
Seth J. Chandler