Square Root Model for Rates of Microbial Growth or Inactivation


Requires a Wolfram Notebook System
Interact on desktop, mobile and cloud with the free Wolfram Player or other Wolfram Language products.
Microbial growth or inactivation starts at a certain characteristic temperature, which is incorporated into temperature-dependent models for their rates. Ratkowski’s model, known as the "square root model" makes use of a minimum temperature. This model, in its original and modified forms, has been successful in describing the increase of a growth rate parameter in a large variety of microorganisms. This Demonstration provides graphical representations of these models’ properties near the onset of microbial growth or thermal inactivation, in which an inactivation rate parameter replaces the growth rate parameter.
Contributed by: Mark D. Normand and Micha Peleg (December 2013)
Open content licensed under CC BY-NC-SA
Snapshots

Details
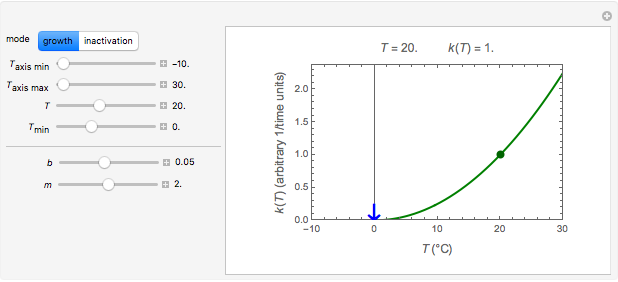
Snapshot 1: growth rate parameter of a psychrophilic organism
Snapshot 2: growth rate parameter of a mesophilic organism
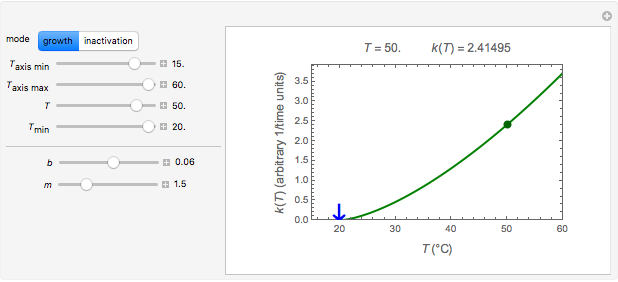
Snapshot 3: growth rate parameter of a thermophilic organism
Snapshot 4: inactivation rate parameter of a vegetative bacterial cell
Snapshot 5: inactivation rate parameter of a heat resistant bacterial endospore
Snapshot 6: inactivation rate parameter of a heat resistant bacterial endospore where 
Ratkowski’s original model was written in the form  , where
  is the growth rate parameter (usually the isothermal growth curve’s slope at its inflection point),
  is the temperature, and
  is the temperature below which growth ceases [1, 2]. The model can also be written in the general form: if
  , 0., else
  , where
  can but need not always be equal to 2 [2, 3].
In principle, the model can also be used for thermal inactivation, where is the inactivation rate parameter and is a temperature marking the onset of lethality [4].
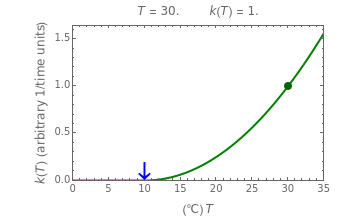
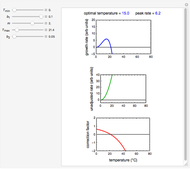
This Demonstration provides a graphical representation of Ratkowski’s model in its original and expanded versions in the region around , that is, before growth is turned into inactivation or vice versa. Choose between pure growth and inactivation with the setter bar. You can use sliders to vary temperature in  , and the magnitudes of
  , , and . The plot of the corresponding versus relationship has a blue arrow marking and a moving point on the curve. The numerical coordinates of the movable point, which are the values of and corresponding , are displayed above the plot.
When , the model yields versus relationships that are reminiscent of those produced by the log-logistic model.
The purpose of this Demonstration is only to illustrate the Ratkowski model and its modifications, not to match any particular organism or process. Therefore, not all parameter combinations allowed by the controls represent realistic growth or inactivation scenarios.
References
[1] D. A. Ratkowski, J. Olley, T. A. McMeekin, and A. Ball, "Relationship between Temperature and Growth Rate of Bacterial Cultures," Journal of Bacteriology, 149(1), 1982 pp. 1–5.
[2] T. Ross, "Bĕlehrádek-Type Models," Journal of Industrial Microbiology and Biotechnology, 12(3–5), 1993 pp. 180–189. doi:10.1007/BF01584188.
[3] L. Huang, C.-A. Hwang, and J. Phillips, "Evaluating the Effect of Temperature on Microbial Growth Rate—The Ratkowski and a Bĕlehrádek-Type Models," Journal of Food Science, 76(8), 2011 pp. M547–M557. doi:10.1111/j.1750-3841.2011.02345.x.
[4] M. M. Gil, T. R. S. Brandão, and C. L. M. Silva, "A Modified Gompertz Model to Predict Microbial Inactivation under Time-Varying Temperature Conditions," Journal of Food Engineering, 76(1), 2006 pp. 89–94. doi:10.1016/j.jfoodeng.2005.05.017.
Permanent Citation
 Lag Time in Microbial Growth
Mark D. Normand and Micha Peleg Estimation of Time to Excessive Microbial Count
Mark D. Normand and Micha Peleg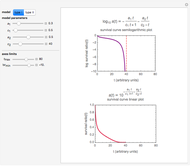 Sigmoid Microbial Survival Curves
Mark D. Normand and Micha Peleg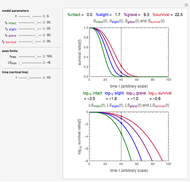 Degrees of Microbial Injury and Survival
Mark D. Normand and Micha Peleg Chaos in Tumor Growth Model with Time-Delayed Immune Response
Clay Gruesbeck Chaos Induced by Delay in Model of the Immune Response
Clay Gruesbeck Injury in Microbial Inactivation
Mark D. Normand and Micha Peleg Extracting Microbial Inactivation Parameters from Final Isothermal Survival Ratios
Mark D. Normand and Micha Peleg Stochastic Model of Microbial Injury and Mortality
Mark D. Normand , Maria G. Corradini, and Micha Peleg Probabilistic Model Showing Sigmoid Semilogarithmic Survival
Mark D. Normand, Micha Peleg, and Zack J. Rosenthal
-
 Ratkowski's Square Root Growth Rate Model for High Temperatures
Micha Peleg -
 Gordon-Taylor and Fox Equations for Glass Transition Temperature
Micha Peleg -
 Force to Overcome Vacuum Pull
Micha Peleg -
 Extending the Square Root Growth Rate Model to Lethal Low Temperatures
Micha Peleg -
 Probability of Being Strange According to Paulos
Micha Peleg -
 Successive Three-Point Method for Weibullian Chemical Degradation
Micha Peleg -
 Estimating Cohesion and Tensile Strength of Compacted Powders
Micha Peleg -
 Three-Endpoints Method for Isothermal Weibullian Chemical Degradation
Micha Peleg -
 Vitamin C Loss in Foods During Heat Processing and Storage
Micha Peleg -
 Parameterizing Temperature-Viscosity Relations
Micha Peleg -
 Laplace Distribution in Fluctuating Stock Index Records
Micha Peleg -
 Weibullian Chemical Degradation
Micha Peleg -
 Simulating Ascorbic Acid Degradation
Micha Peleg -
 Additive and Multiplicative Risks
Micha Peleg -
 Endpoints Method for Predicting Chemical Degradation in Frozen Foods
Micha Peleg -
 Exponential Model for Arrhenius Activation Energy
Micha Peleg -
 Prediction of Isothermal Degradation by the Endpoints Method
Micha Peleg -
 Risk Guesstimation from Factor Ranges
Micha Peleg -
 Volatiles Formation Kinetics in Stored Fish
Micha Peleg -
 Comparison of Six Sigmoid Growth Curve Models
Micha Peleg